2019: Issue 672, Week: 25th February – 01st March
A Weekly Update from SMC (For private circulation only)
WISE M NEY
NEY


2019: Issue 672, Week: 25th February – 01st March
A Weekly Update from SMC (For private circulation only)
 NEY
NEY 


| Equity | 4-7 |
| Derivatives | 8-9 |
| Commodity | 10-13 |
| Currency | 14 |
| IPO | 15 |
| FD Monitor | 16 |
| Mutual Fund | 17-18 |
U
.S. and China trade talk uncertainties along with global economic growth concerns continue to cast its shadow on the global stock markets. Investors were cautious ahead of a meeting between the U.S. and China in Beijing, where the world’s two largest economies attempt to resolve their trade dispute. Meanwhile China’s factory inflation decelerated for seventh consecutive month adding to worries that it will have on already weak corporate profits. Exports from China rose by 9.1 per cent in the month of January, reversing 4.4% decline in December. Imports were lower by 1.5 per cent following 7.6 per cent decline in the prior month. China's trade surplus with all trading partners stood at $39.16 billion in January, much smaller than the $57.06 billion surplus recorded in December. Japanese economy grew at a rate of 1.4 per cent in the quarter ending December 2018 following a contraction of 2.6 per cent in the prior month. Growth in the economy saw a rebound on the back of solid spending by households and companies.
Back at home, India's wholesale price inflation (WPI) cooled to 2.76% in January from 3.8% in December. Consumer inflation came at 2.05 per cent from 2.11 per cent in the prior month. It was 3.02% in January last year. The decline in inflation has further increased the probability of the RBI to cut interest rates in the up-coming months. Easing retail inflation gave a fillip to the rupee too. Meanwhile, Industrial production growth came at 2.4 per cent in December 2018 compared with 0.3% growth recorded in November 2018. The Decemberquarter results brought little cheer to investors. Going forward, with the result season almost through, markets will take cues from global markets. Besides, the crude price movements, Rupee movements and inflow/outflow of funds by the foreign and domestic institutional investors will dictate the trend of the stock market.
On the commodity market front, commodities traded in ambiguity as investors are also awaiting further > developments from ongoing U.S.-China trade talks before making any big moves. Bullion counter may trade with sideways to upside bias. Gold is likely to take support near 32650 – 32800 zone while its upside will be capped near 33400 levels. Crude oil prices may continue to remain on upbeat note as U.S. sanctions against Venezuela and Iran and supply cuts led by OPEC to boost the sentiments higher. Crude oil has potential to touch the upside of 4150 levels. In base metal counter, prices can trade with sideways bias with lower level buying can be seen in near term. German ZEW Survey Expectations, Euro-Zone ZEW Survey, FOMC Meeting Minutes, Unemployment Rate of Australia, Durable Goods Orders of US, National Consumer Price Index of Japan, etc are few data are scheduled this week, which should be taken care of while trading in commodities.

SMC Global Securities Ltd. (hereinafter referred to as “SMC”) is a registered Member of National Stock Exchange of India Limited, Bombay Stock Exchange Limited and its associate is member of MCX stock Exchange Limited. It is also registered as a Depository Participant with CDSL and NSDL. Its associates merchant banker and Portfolio Manager are registered with SEBI and NBFC registered with RBI. It also has registration with AMFI as a Mutual Fund Distributor.
SMC is a SEBI registered Research Analyst having registration number INH100001849. SMC or its associates has not been debarred/ suspended by SEBI or any other regulatory authority for accessing /dealing in securities market.
SMC or its associates including its relatives/analyst do not hold any financial interest/beneficial ownership of more than 1% in the company covered by Analyst. SMC or its associates and relatives does not have any material conflict of interest. SMC or its associates/analyst has not received any compensation from the company covered by Analyst during the past twelve months. The subject company has not been a client of SMC during the past twelve months. SMC or its associates has not received any compensation or other benefits from the company covered by analyst or third party in connection with the research report. The Analyst has not served as an officer, director or employee of company covered by Analyst and SMC has not been engaged in market making activity of the company covered by Analyst.
The views expressed are based solely on information available publicly available/internal data/ other reliable sources believed to be true.
SMC does not represent/ provide any warranty express or implied to the accuracy, contents or views expressed herein and investors are advised to independently evaluate the market conditions/risks involved before making any investment decision.
DOMESTIC NEWS
Economy
• India's consumer price inflation slowed in January, the consumer price index rose 2.05 percent year-on-year following a 2.11 percent climb in December, which was revised from 2.19 percent.
• India's wholesale price inflation eased for a third month and at a faster than expected pace in January. Wholesale prices climbed 2.76 percent year-on-year in January after a 3.8 percent rise in December. Economists had expected a 3.7 percent increase.
• India's factory output growth grew 2.4 percent in December after hitting a 17-month low of 0.5 percent in November. Manufacturing sector output, which accounts for more than three-fourths of the entire index, grew 2.7 percent in December from a deceleration of (-) 0.4 percent in November.
Pharmaceuticals
• Aurobind Pharma has completed the Euro 74-million deal to acquire Apotex's commercial operations and certain supporting infrastructure in five European countries. The company had inked a binding agreement on July 14, 2018, to acquire five of Apotex' European businesses, including infrastructure, certain established trademarks, marketing authorizations and dossier licence rights in Poland, the Czech Republic, the Netherlands, Spain and Belgium.
• Dr. Reddy's Laboratories announced the launch of Tadalafil Tablets USP, a therapeutic equivalent generic version of Adcirca (tadalafil) Tablets in the United States market, approved by the U.S. Food and Drug Administration (USFDA). The Adcirca brand and generic had U.S. sales of approximately $490 million MAT for the most recent twelve months ending in November 2018 according to IMS Health.
Information Technology
• Tata Consultancy Services (TCS) has signed a global partnership with JDA Software, provider of end-to-end supply chain and retail solutions, to build next-generation cognitive solutions. Under the agreement, it will also offer consulting and system integration services around digital technologies to optimize supply chains for customers worldwide.
Automobiles
• Mahindra & Mahindra launched a new SUV, the XUV300, which is a souped down variant of the premium model XUV500. The sub-4 meter XUV300 comes in both petrol and diesel options, and are priced in the range of Rs 7.90-8.49 lakh, respectively, and is powered by a 1.2-litre (petrol) and 1.5- litre (diesel) engine.
Gas Distribution
• Petronet LNG signed an initial agreement with Tellurian Inc to invest in its proposed Driftwood project in Louisiana in the United States and buy liquefied natural gas (LNG). The deal, reached during a high level U.S.-India commercial dialogue to advance trade and investment, will represent company’s first U.S. investment.
INTERNATIONAL NEWS
• U.S. initial jobless claims increased to 239,000, an increase of 4000 from the previous week's revised level of 235,000. Economists had expected jobless claims to drop to 225,000.
• U.S. business inventories edged down by 0.1 percent in November after climbing by 0.6 percent in October. Inventories had been expected to rise by 0.3 percent.
• U.S. retail sales tumbled by 1.2 percent in December after inching up by a revised 0.1 percent in November. Economists had expected retail sales to rise by 0.2 percent, matching the uptick originally reported for the previous month.
• U.S. consumer price index was unchanged in January, matching the revised reading for December. Economists had expected consumer prices to inch up by 0.1 percent.
• China CPI slows in January; Consumer prices in China were up 1.7 percent on year in January. That was shy of expectations for an increase of 1.9 percent, which would have been unchanged from the December reading.
• Japan's gross domestic product (GDP) grew in October-December as solid domestic consumption and business investment offset weak exports. The economy expanded at an annualized 1.4 percent rate in the fourth quarter.
| Stocks | *Closing Price | Trend | Date Trend Changed | Rate Trend Changed | SUPPORT | RESISTANCE | Closing S/l |
|---|---|---|---|---|---|---|---|
| S&P BSE SENSEX | 35809 | DOWN | 05.10.18 | 34970 | 35400 | 34700 | |
| NIFTY50 | 10724 | DOWN | 05.10.18 | 10316 | 10600 | 10400 | |
| NIFTY IT* | 15816 | UP | 21.07.17 | 10712 | 15200 | 14800 | |
| NIFTY BANK | 26794 | UP | 30.11.18 | 26863 | 25900 | 25400 | |
| ACC | 1352 | DOWN | 24.01.19 | 1420 | 1420 | 1450 | |
| BHARTIAIRTEL | 305 | DOWN | 25.01.18 | 453 | 330 | 340 | |
| BPCL | 328 | DOWN | 15.02.19 | 328 | 350 | 350 | |
| CIPLA* | 541 | DOWN | 26.10.18 | 604 | - | 545 | |
| SBIN** | 263 | UP | 02.11.18 | 286 | - | 260 | |
| HINDALCO | 187 | DOWN | 04.01.19 | 211 | 205 | 210 | |
| ICICI BANK*** | 342 | UP | 02.11.18 | 355 | - | 340 | INFOSYS | 742 | UP | 14.12.18 | 706 | 690 | 670 |
| ITC | 280 | UP | 11.01.19 | 295 | 280 | 275 | |
| L&T | 1243 | DOWN | 18.01.19 | 1318 | 1300 | 1330 | |
| MARUTI | 6930 | DOWN | 14.09.18 | 8627 | 7300 | 7500 | |
| NTPC | 136 | DOWN | 26.10.18 | 159 | 143 | 147 | |
| ONGC | 135 | DOWN | 05.10.18 | 147 | 145 | 150 | |
| RELIANCE | 1244 | UP | 30.11.18 | 1168 | 1200 | 1170 | |
| TATASTEEL | 468 | DOWN | 26.10.18 | 552 | 490 | 510 | |
*CIPLA has breached the resistance of 540 **SBIN has broken the support of 270 ***ICICIBANK has broken the support of 350
Closing as on 15-02-2019
NOTES:
1) These levels should not be confused with the daily trend sheet, which is sent every morning by e-mail in the name of "Morning Mantra ".
2) Sometimes you will find the stop loss to be too far but if we change the stop loss once, we will find more strength coming into the stock. At the moment, the stop loss will be far as we are seeing the graphs on weekly basis and taking a long-term view and not a short-term view.
| Meeting Date | Company | Purpose |
|---|---|---|
| 18-Feb-19 | Ambuja Cements | Financial Results/Dividend |
| 18-Feb-19 | Mcnally Bharat Engg. Co. | Financial Results |
| Financial Results | Huhtamaki PPL | Financial Results/Dividend |
| 18-Feb-19 | Engineers India | Financial Results/Dividend |
| 19-Feb-19 | Linde India | Financial Results/Dividend |
| 20-Feb-19 | Mahindra CIE Automotive | Financial Results |
| 20-Feb-19 | Varun Beverages | Financial Results |
| 26-Feb-19 | HDFC AMC | Dividend |
| 26-Feb-19 | Sanofi India | Financial Results/Dividend |
| 27-Feb-19 | Rain Industries | Financial Results |
| 28-Feb-19 | Bharti Airtel | Fund Raising/Other business matters |
| 28-Feb-19 | Bharti Airtel | Fund Raising/Other business matters |
| 1-Mar-19 | ABB India | Financial Results/Dividend |
| Ex-Date | Company | Purpose |
|---|---|---|
| 18-Feb-19 | VIP Industries | Interim Dividend - Rs 1.20 Per Share |
| 18-Feb-19 | Transport Corp of India | Interim Dividend - Re 1 Per Share |
| 18-Feb-19 | SJVN | Interim Dividend - Rs 1.50 Per Share |
| 18-Feb-19 | NHPC | Int Div - Rs 0.71 Per Sh |
| 18-Feb-19 | HIL | Interim Dividend - Rs 12.50 Per Share |
| 21-Feb-19 | Oil India | Interim Dividend - Rs 8.50 Per Share |
| 21-Feb-19 | BPCL | Interim Dividend Rs - 11 Per Share |
| 21-Feb-19 | CARE Ratings | Interim Dividend - Rs 6 Per Share |
| 21-Feb-19 | Page Industries | Interim And Special Dividend |
| 21-Feb-19 | Minda Corporation | Interim Dividend - Re 0.25 Per Share |
| 25-Feb-19 | Triveni Engg. & Industries | Interim Dividend - Re 0.70 Per Share |
| 28-Feb-19 | ONGC | Interim Dividend |
| 5-Mar-19 | ACC | Dividend - Rs 14 Per Share |

4


5
MPHASIS LTD
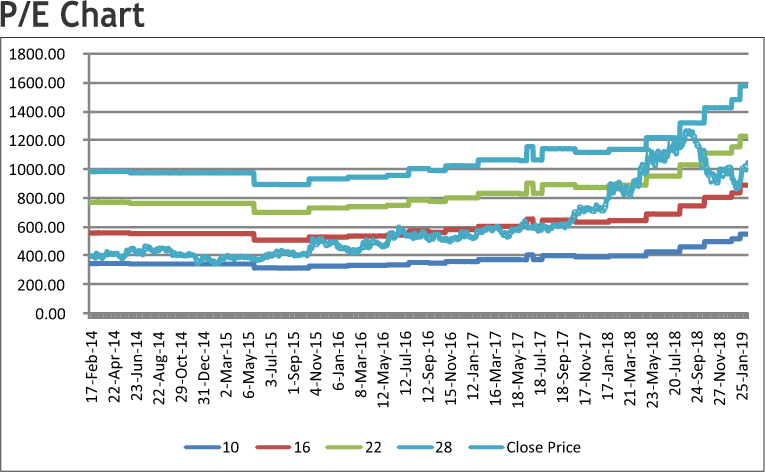
CMP: 1054.00
Target Price: 1197
Upside: 14%
| Face Value (Rs.) | 10.00 |
| 52 Week High/Low | 1278.00/802.05 |
| M.Cap (Rs. in Cr.) | 19468.61 |
| EPS (Rs.) | 43.42 |
| P/E Ratio (times) | 24.09 |
| P/B Ratio (times) | 5.42 |
| Dividend Yield (%) | 1.99 |
| Stock Exchange | BSE |
Investment Rationale
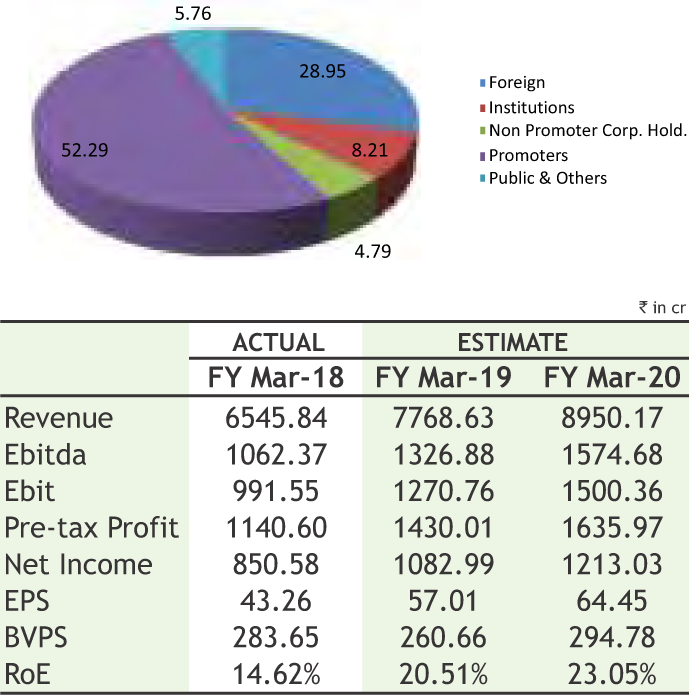
• Mphasis Limited is an IT solutions provider specializing in cloud and cognitive services. Its core reference architectures & tools, combined with strong domain expertise in Banking, Financial Services & Insurance verticals and deep relationship with marquee global customers has enabled growth above industry average.
• Recently, it has acquired US Based cloud automation company Stelligent systems LLC for a consideration of Rs. 180 Crores. The deal will boost Mphasis’ endto-end capabilities in the public cloud domain. This will also give it an edge in jostling the market share by providing customized services.
• The company continues to build a strong revenue pipeline pivoted around new-gen services. Direct International business won new deals worth $122 mn (Rs. 860 Crores) of TCV (Total Contract Value) in Q3 FY19, with 81% of wins in the new-gen services. This takes the year to date TCV wins to $484 mn (Rs. 3,400 Crores), thereby providing good revenue visibility. The company is seeing good deal traction in Cloud Partnership and has won significant transformation deals.
• In Q3 FY19 revenues grew 2.8% QoQ and 23.5% on a YoY basis. The growth was 3.1% QoQ and 14% YoY in constant-currency terms which was primarily driven by Direct Core and DXC/HP businesses. Operating margins improved 30 basis points YoY to 15.8%, primarily led by revenue growth and operational efficiencies.
• The management is confident of operating within the guided band of 15% to 17% EBIT Margin for FY 2019.
New-Gen Services revenue grew 50.8% YoY and Direct Core revenue grew by 46.4% in Q3 FY19. All the verticals especially travel and logistics, health care and manufacturing have seen good growth in emerging markets. In the quarter, the headcount increased to 24,215 employees with an utilisation level of 87%.
Risk
• Foreign Exchange fluctuation
• Security of Information assets
Valuation
Recent performance makes it very evident that the company has put its cloud and cognitive strategy in action, with the acquisition of Stelligent and launch of multiple client wins in these areas. Sustained execution roadmap across the portfolio, especially in New Gen Services and focus on execution of deal pipeline will support the growth momentum, going forward. We expect the stock to see a price target of Rs. 1197 in 8-10 months time frame on an expected P/Ex of 18.57 times and FY20E EPS of Rs. 64.45.
J B CHEMICALS & PHARMACEUTICALS LTD
CMP: 310.70
Target Price: 355
Upside: 14%
| Face Value (Rs.) | 2.00 |
| 52 Week High/Low | 351.00/236.00 |
| M.Cap (Rs. in Cr.) | 2492.95 |
| EPS (Rs.) | 13.19 |
| P/E Ratio (times) | 23.56 |
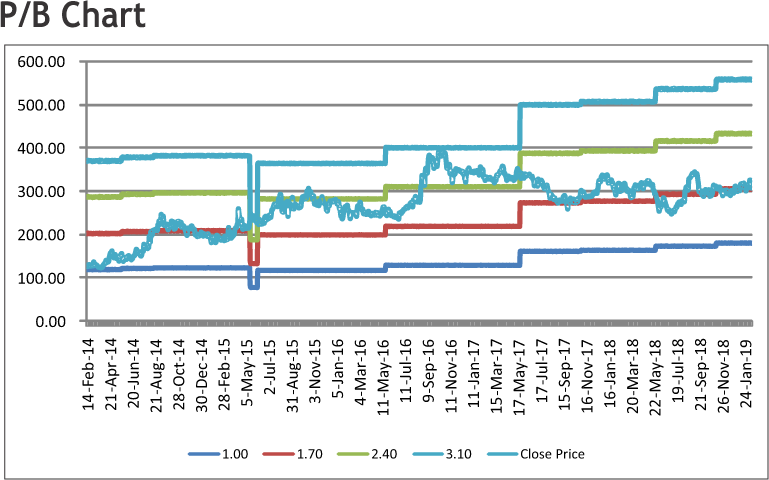
| P/B Ratio (times) | 1.73 |
| Dividend Yield (%) | 0.67 |
| Stock Exchange | BSE |
Investment Rationale
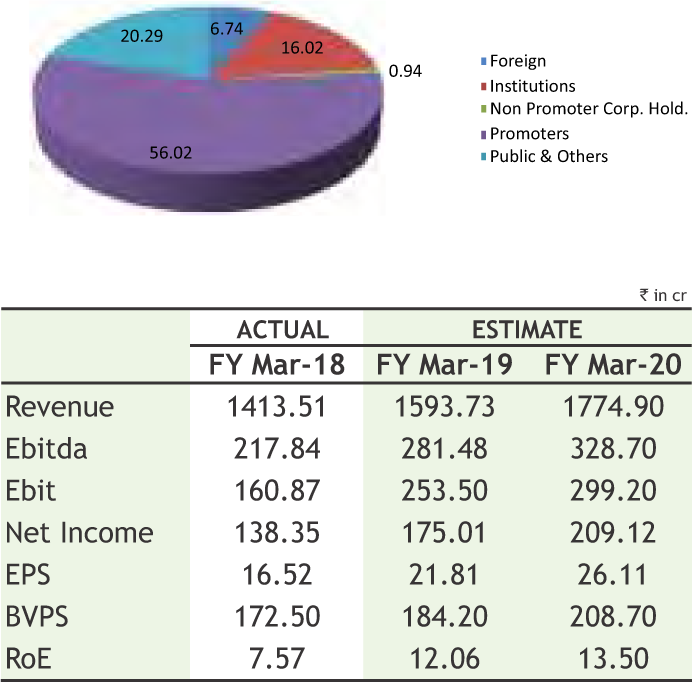
• JB Chemicals & Pharmaceuticals Limited (JBCPL), one of India’s leading pharmaceutical companies, manufactures & markets a diverse range of pharmaceutical formulations, herbal remedies and APIs. JBCPL exports to many countries worldwide with presence in US, Europe, Australia, South Africa, other developing countries, Russia and CIS.
• JB Chemicals & Pharmaceuticals Limited (JBCPL), one of India’s leading pharmaceutical companies, manufactures & markets a diverse range of pharmaceutical formulations, herbal remedies and APIs. JBCPL exports to many countries worldwide with presence in US, Europe, Australia, South Africa, other developing countries, Russia and CIS.
• It has a consistent, strong free cash flow annually, with a low debt-equity of 0.03x.
• Wide geographical presence in the international market, increased focus on ANDA filings, focus on new products introduction in Russia-CIS market, focus on lucrative contract manufacturing business backed by State-of-the-art manufacturing facilities with approval from health authorities such as US FDA, UK MHRA, TGA Australia, MCC South Africa, MoH-Russia, Ukraine (PICs), ANVISA Brazil, MoHJapan, and wide range of products across injectable, solid and semi-solid present a good opportunity in international business.
• It focuses on harnessing potential of existing products, launching of new line extensions and achieving of new line productivity will be pursued with scientific product promotions and aggressive marketing strategies. The stringent initiatives taken have resulted in rationalization of inventory position and release of cash for growth.
• The future outlook for the industry and growth expectations remains positive in view of increased government and private spending on healthcare.
• The Research and Development (R&D) division of the company continues to play an important role in the company’s growth. The company has a strong R&D and regulatory set-up for development of new drug delivery system and formulations, filing of DMFs and ANDAs. Its State-of-the-Art manufacturing facilities are approved by health authorities of regulated markets.
Risk
• Regulatory risks
• Currency Fluctuation
Valuation
The company accords high priority to domestic formulations business, which offers significant value proposition. During the current year, the company plans to continue to pursue focus on harnessing potential of the existing products, launch new products selectively and achieve increased productivity. Thus, it is expected that the stock will see a price target of Rs.355 in 8 to 10 months time frame on a target P/BVx of 1.7x and FY20 BVPS of Rs.208.7.
Source: Company Website Reuters Capitaline
Above calls are recommended with a time horizon of 8 to 10 months.

6
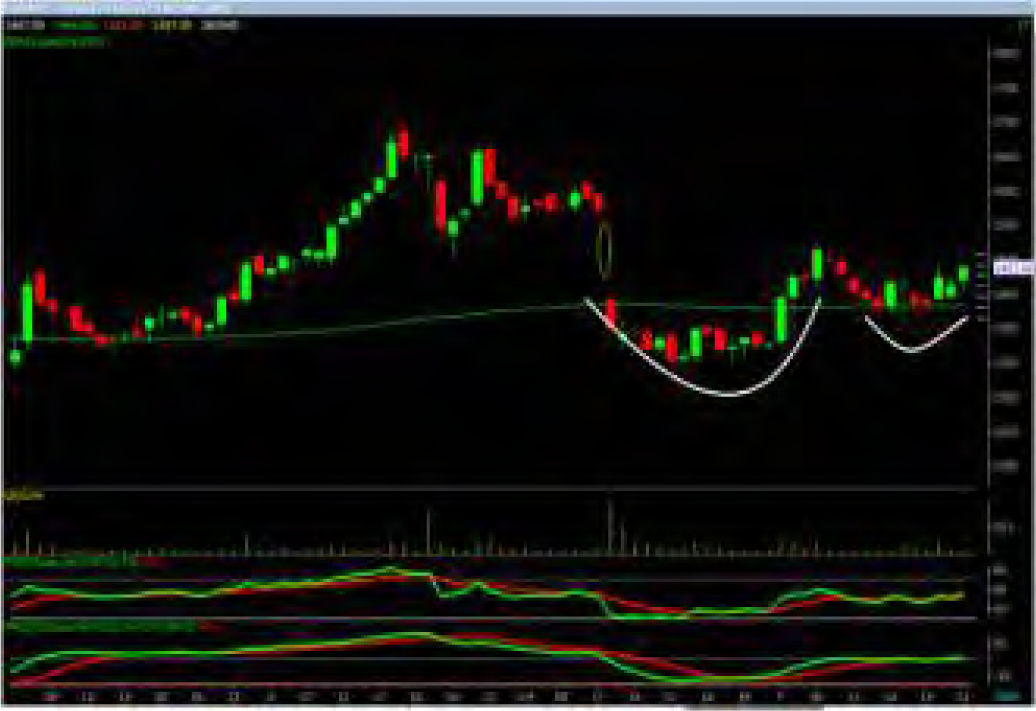
The stock closed at Rs 2825.95 on 15th February, 2019. It made a 52-week low at Rs 2420 on 25th October 2018 and a 52-week high of Rs. 3194.95 on 12th July 2018. The 200 days Exponential Moving Average (DEMA) of the stock on the daily chart is currently at Rs 2765.22
As we can see on charts that stock is forming an “Inverted Head and Shoulder” pattern on weekly charts, which is bullish in nature. Last week, selling was witnessed across the board but stock has managed to close on verge of breakout of pattern so follow up buying can continue for coming days. Apart from this, it is comfortably trading above 100 WEMA on weekly charts, which also gives positive outlook for the stock. Therefore, one can buy in the range of 2790-2800 levels for the upside target of 3000-3040 levels with SL below 2740.
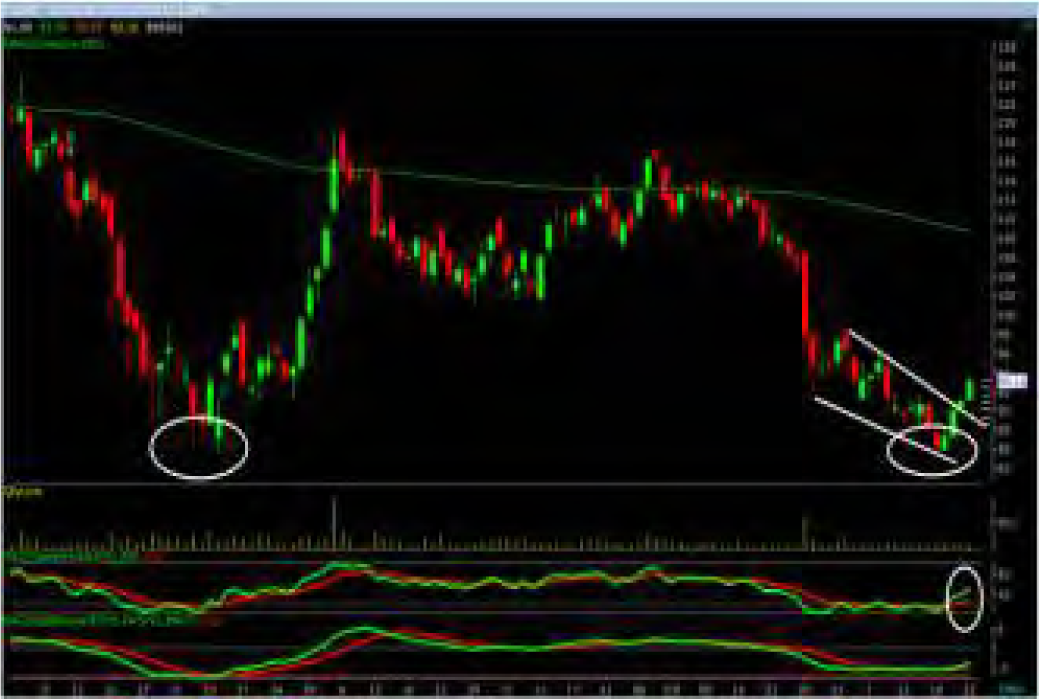
The stock closed at Rs 1254.75 on 15th February, 2019. It made a 52-week low at Rs 673.90 on 20th March 2018 and a 52-week high of Rs. 1283.30 on 13th February 2019. The 200 days Exponential Moving Average (DEMA) of the stock on the daily chart is currently at Rs 988.45
Short term, medium term and long term bias are positive for the stock as it is continuously trading in higher highs and higher lows sort of “Rising Wedge” on weekly charts, which is considered to be bullish. Last week, stock has given the breakout of pattern by registered gains over 5% and also has managed to close above the same. Therefore, one can buy in the range of 1230-1235 levels for the upside target of 1320-1340 levels with SL below 1170.
Disclaimer : The analyst and its affiliates companies make no representation or warranty in relation to the accuracy, completeness or reliability of the information contained in its research. The analysis contained in the analyst research is based on numerous assumptions. Different assumptions could result in materially different results.
The analyst not any of its affiliated companies not any of their, members, directors, employees or agents accepts any liability for any loss or damage arising out of the use of all or any part of the analysis research.
SOURCE: CAPITAL LINE
Charts by Spider Software India Ltd
Above calls are recommended with a time horizon of 1-2 months

7
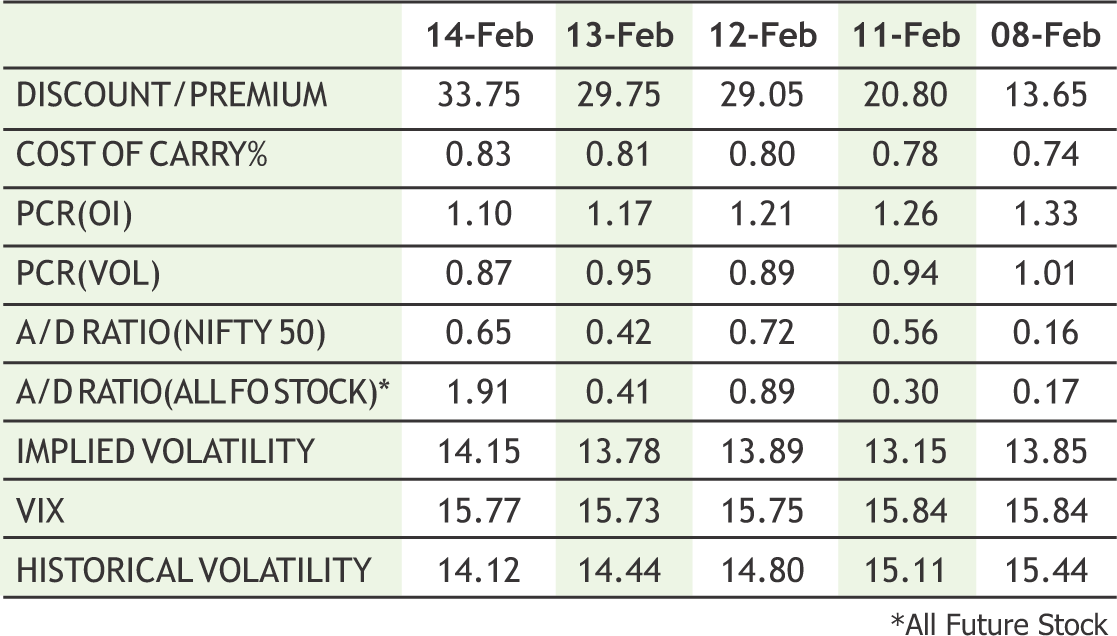
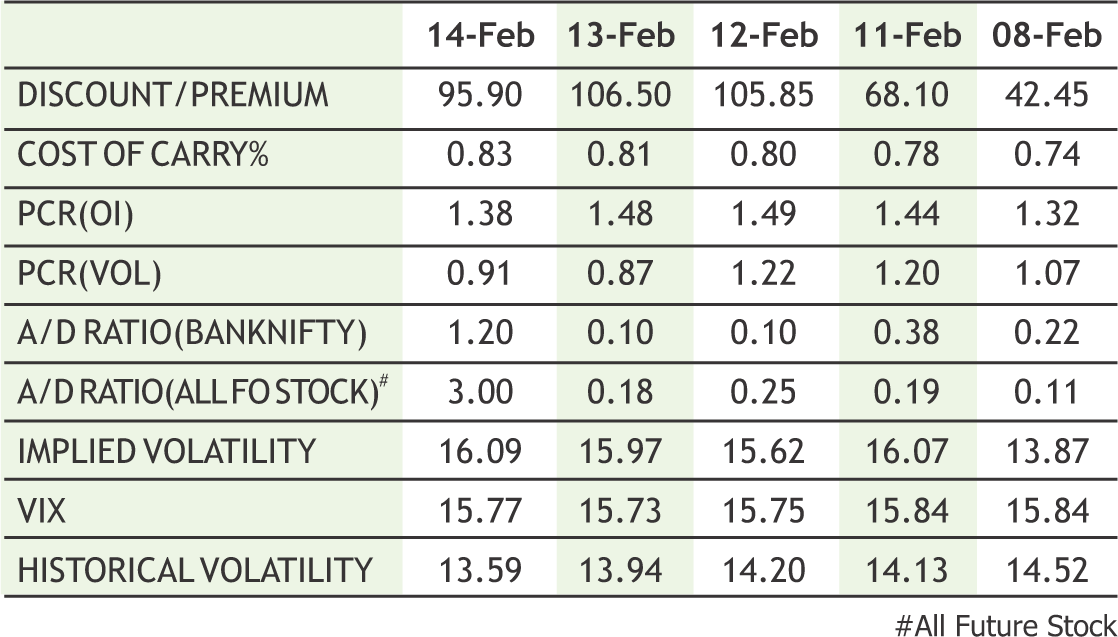
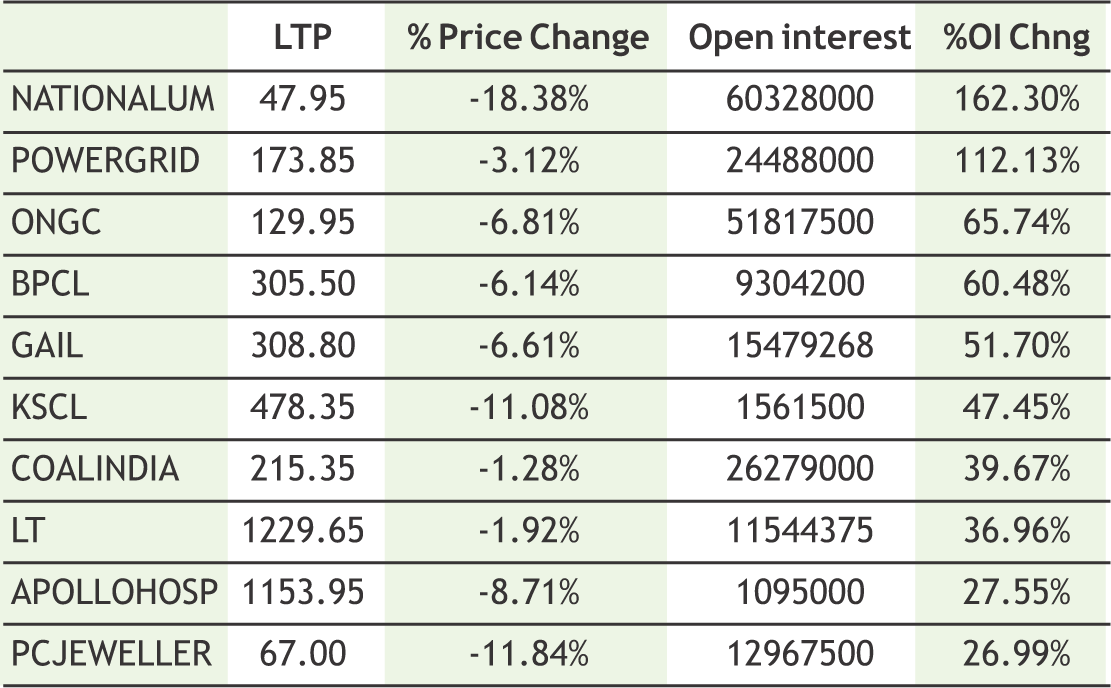
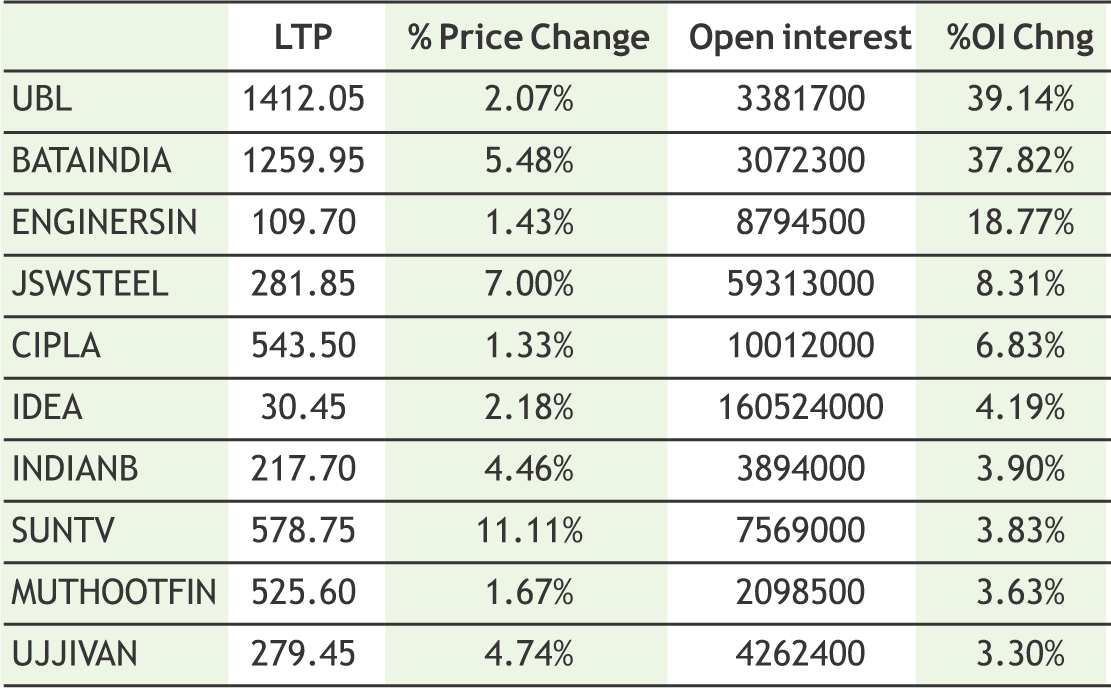
Nifty dragged down due to liquidation of long positions. Recent data has again turned cautious and is indicating probability of further profit booking. Call writing and put unwinding were seen in recent trading sessions. Call writes were active in 10800, 10900 strike calls indicating limited upside. This clearly indicates lack of buying interest and discomfort in the market. The levels of 10600 will remain crucial for this week as indicated by option open interest concentration. If Nifty falls below the 10600 mark, it could correct to 10500 levels on the back of further selling. On bounce, the index will face strong resistance at 10800-10850 levels. The options open interest concentration is at the 11000-strike calls with the highest open interest of above 40 lakh shares; among put options, the 10700 & 10400 -strike taking the total open interest to 30 lakh shares each, with the highest open interest among put options. Next support is placed around 10600-10550 levels.


8
|
|

|
|
**The highest call open interest acts as resistance and highest put open interest acts as support.
# Price rise with rise in open interest suggests long buildup | Price fall with rise in open interest suggests short buildup
# Price fall with fall in open interest suggests long unwinding | Price rise with fall in open interest suggests short covering

9
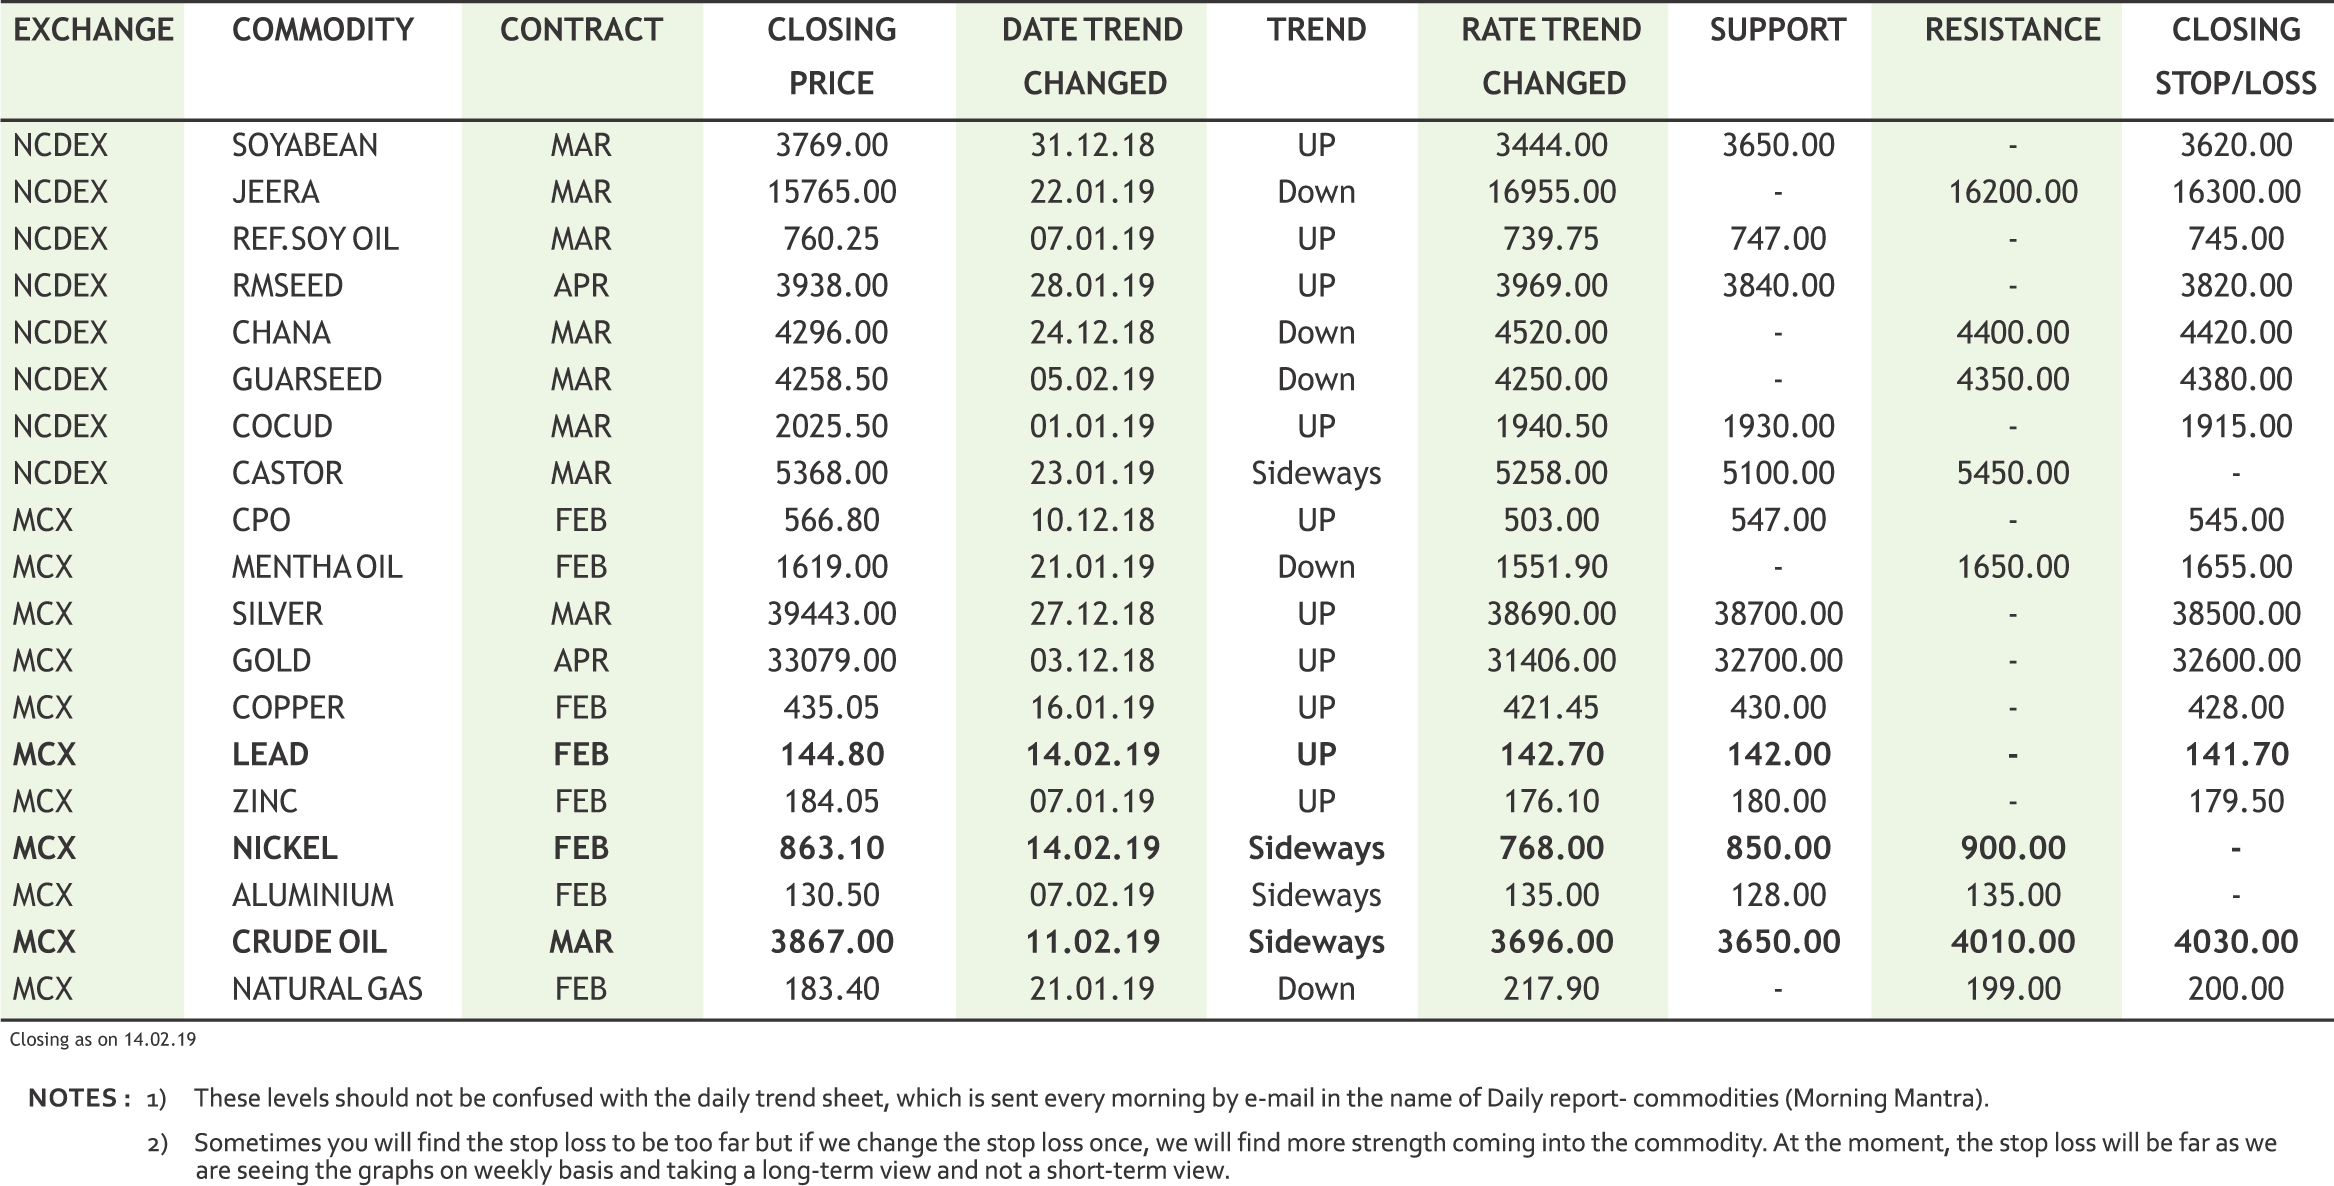
The upside in turmeric futures (Apr) may remain restricted near 6450 levels. The new crop arriving in the key producing regions of Tamil Nadu and Telangana in addition with expectation of a higher crop may keep the upside capped. The deficiency of cultivation area in Telangana & Tamil Nadu has been covered up by Maharashtra, where the area under turmeric has increased substantially this year and hence they are expecting an increase of 15 per cent in turmeric production in 2018-19. Also, the demand is sluggish mainly due to the higher moisture content in the produce being brought by farmers to the markets. Jeera futures (Mar) is seen taking a U-turn upside towards 16100- 16150 levels, forming a base in the range of 15400-15600 levels. Taking advantage of lower level buying, the market participants have started taking long positions as this season India has become the sole supplier of jeera to the world. The competitive producers Syria & Turkey are getting washed out of trade & uncompetitive in the export market. The exporters are getting ready to begin their buying spree and the quality of this year crop is expected to be good. With arrivals of the new crop expected by mid-February and prices already moving higher, the sentiments are turning to be bullish. Coriander futures (Apr) will possibly trade range bound within 6200-6600 levels. The downside may remain capped as the spot markets in Rajasthan, Gujarat and Madhya Pradesh are sending positive signals since the farmers are not interested in bringing their produce in mandis at existing lower prices.
Bullion counter may trade with sideways to upside bias. U.S. Federal Reserve’s “patient” monetary policy approach and less than expected US economic data is keeping the prices supported. But stronger greenback and possible resolution of US China trade war concerns is expected to keep upside capped. Gold can take support near 32650 levels while its upside will be capped near 33400 levels while silver can take key support near 39100 levels and can recover towards 39900 levels. Last week, US retail sales fell by 1.2% from prior month, worst drop in 9 years. A weaker economic momentum backed expectations that U.S. Federal Reserve would pause further interest rate hikes, which pressured dollar and supported gold. Meanwhile, the risk of a U.S. recession is not currently elevated, Federal Reserve Chairman Jerome Powell stated last week. Donald Trump stated that trade talks with China were “going along very well” as the world’s two largest economies try to resolve their seven-month tariff war ahead of a March 1 deadline for a deal. According to central bank data “China’s gold reserves were at 59.94 million fine troy ounce at end-January versus 59.56 million troy ounce at end-December” Meanwhile, British Prime Minister Theresa May suffered a defeat on her Brexit strategy that undermined her pledge to European Union leaders to get her divorce deal approved if they grant her concessions. Germany’s economy stalled in the final quarter of last year, just skirting recession as fallout from global trade disputes and Brexit put the brakes on a decade of expansion.
Soybean futures (Mar) is likely to witness sell on rise from 3800 levels & is expected to test 3650 levels on the downside. The initial estimates coming from the Soybean Processors’ Association (SOPA) shows that in the upcoming Kharif season output is likely to rise by a staggering 38% on a sharp increase in average yield across the country. India’s soybean output at 11.48 million tonnes this year compared to 8.3 million tonnes in the previous year on favourable climatic condition. This increase in production is being attributed to the major producing state in Madhya Pradesh wherein the yield is estimated to rise by 30.5% to 1,094 kg per ha for the current season from 838 kg from the previous season. The survey also highlighted that in Maharashtra output is estimated to rise by 32% to 3.84 million tonnes for this year from 2.91 million ha last year. Soy oil futures (Mar) is expected to face resistance near 770 levels & trade with a downside bias. Demand in the physical market is subdued from millers and crushers with ongoing lean season for soybean and oil market. CPO futures (Mar) is expected to plunge further & test 655-650 levels on reports of higher imports. The latest statistics show that imports of palm oils including RBD Palmolein and CPO touched 23.18 lakh tonnes (lt), up from 22.74 lt reported in the same period last year. Mustard futures (Apr) will possibly remain stable in the range of 3900-3970 levels. The changing weather patterns causing rainfall over the major growing regions where the crops are in the fields are bringing concerns over the production scenario.
Crude oil prices may continue to remain on upbeat note as U.S. sanctions against Venezuela and Iran and supply cuts led by the Organization of the Petroleum Exporting Countries to boost the sentiments higher. OPEC and some non-affiliated suppliers including Russia are withholding supply in order to tighten the market and prop up prices. Crude oil can test 4150 levels while taking support near 3700 levels. Supply issues in Venezuela are also bolstering oil markets as the country suffers a political and economic crisis, with Washington introducing petroleum export sanctions against state-owned energy firm PDVSA. The producer group known as OPEC+ has agreed to cut crude output by a joint 1.2 million barrels per day (bpd). Top exporter Saudi Arabia stated that it would cut even more in March than the deal called for. Refining profits for gasoline have plunged since mid-2018, going negative in Asia and Europe, amid tepid demand growth and a surge in supply. The surge in U.S. crude oil production, which tends to be light in quality and which has risen by more than 2 million barrels per day (bpd) last year to a record 11.9 million bpd EIA, had resulted in overproduction of gasoline. OPEC, in its monthly forecasts, lowered forecast of OPEC demand by 0.2 mn bpd to 30.6 million bpd. Natural gas counter may try to find some support near 175-185 range and can recover towards 200 levels. Meanwhile weather is expected to be colder than normal for most of west coast and Midwest for both the 6-10 and 8-14 day forecast in US.
Cotton futures (Feb) is expected to bounce back amid short covering and lower level buying taking support near 19990. On the spot markets, cotton prices are expected to remain firm this year due to lower production in the country, apart from rising consumption. In the international markets, the traders are keeping an eye on what's going on over in Beijing for some positive news. High-level officials from the US and China are in talks as a critical trade war deadline is getting closer since March 1 marks the deadline for the current 90-day pause in the trade war. Chana futures (Mar) is expected to intensify its rally & test 4400 as soon as it crosses the resistance near 4335 levels. Dal mills have kicked off stocking to build inventory after a jump in arrival of pulses from fresh harvest that is likely to double up in coming weeks. Dal mills purchase raw pulses from market and then process it into dal of various grades. On processing 60% comes out as dal, while 25% goes as cattle feed. The rest is wasted. Another reason for the upside momentum is being attributed to the market talks that Nafed will not sell chana in open markets and will go to build buffer stock around 10 lakh tonnes. The trend of mentha oil (Feb) is bullish & the upside may continue till 1680-1720 levels. Weather disturbances in the major growing areas are giving signals of delayed sowing in the key growing areas of Uttar Pradesh. Moreover, demand from both domestic and export fronts are emerging at existing price levels. Export demand has started to pick up from China.
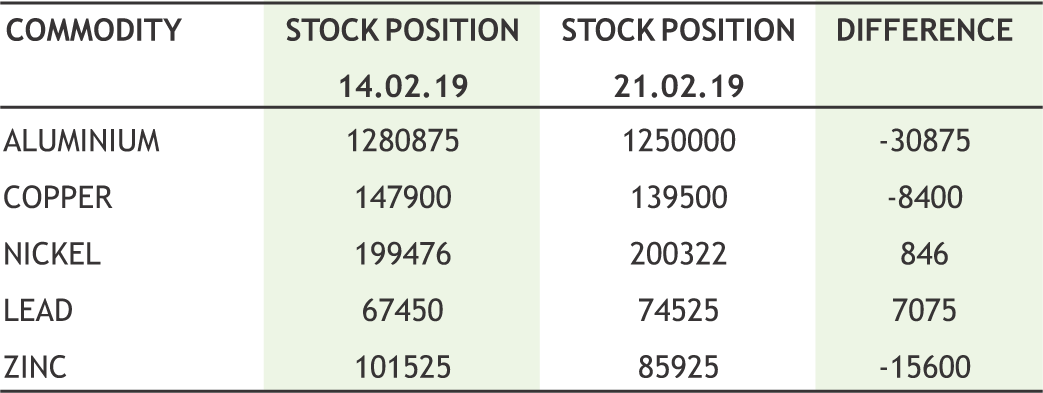
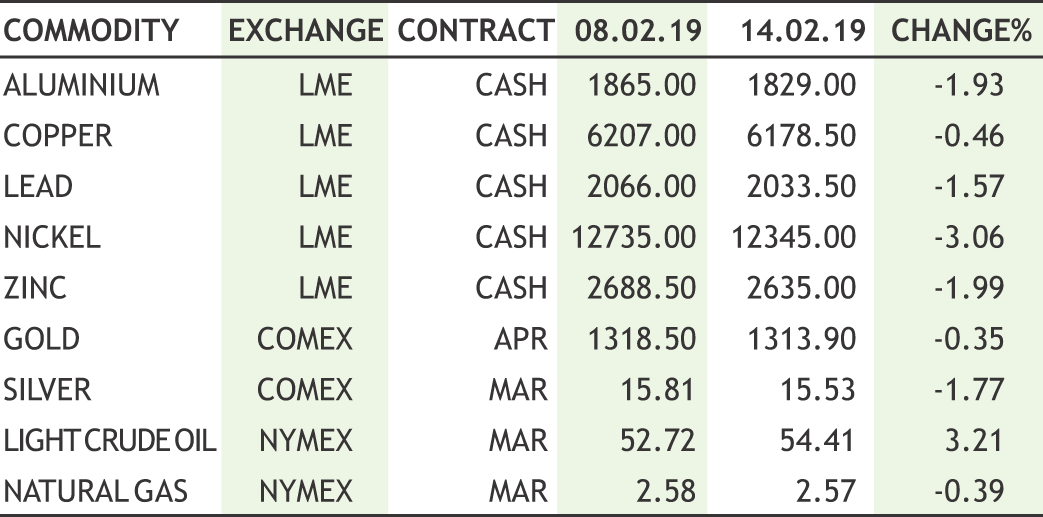
In base metal counter, prices can trade with sideways bias with lower level buying can be seen in near term. Declining stockpiles and increase in China exports data supported the prices but China's factory-gate price growth missed expectations and investors awaited their cue from the outcome of Sino-U.S. trade talks in Beijing. According to Chinese customs data, “January dollar denominated exports meanwhile rose 9.1 percent from a year ago”. Copper may find some support near 425 and can recover towards 448. China’s unwrought copper imports came in at 479,000 tonnes up 14% MoM and up 8.9% YoY from 440,000. The discount for the cash against the three-month copper contract has narrowed to zero from $8 a tonne. Meanwhile, Lead may take support near 141 levels and can recover towards 150. Aluminium can trade with mixed bias in range of 128 -136 levels. Zinc may try to hold the 180-185 range and can recover towards 195. Zinc prices took a breather after the recent fall as Floods in Queensland are set to disrupt the rail delivery of zinc exports to the northern port of Townsville, with the line likely to be out of action for at least a month. LME zinc stocks are at their lowest since January 2008, but cash zinc was trading at a discount of $US6.25 a tonne to the threemonth price , down from a premium of $US125 in early December, in a sign of weaker immediate demand. Nickel can also find some support near 850-840 range and can recover towards 900 levels.

10
|
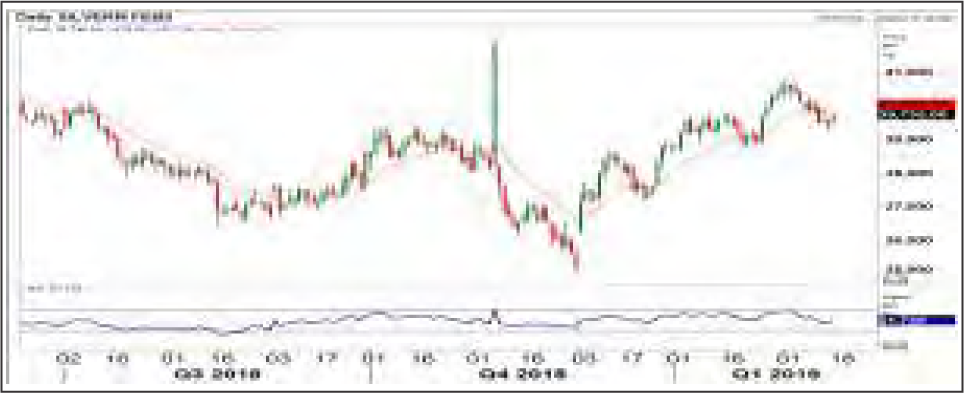
SILVER MCX (MARCH) contract closed at Rs. 39456 on 14th Feb’19. The contract made its high of Rs. 41777 on 9th Jul’18 and a low of Rs. 35924 on 30th Nov’18 . The 18-day Exponential Moving Average of the commodity is currently at Rs. 39553. On the daily chart, the commodity has Relative Strength Index (14-day) value of 61.83.
One can buy at Rs. 39200-39250 for a target of Rs. 40500 with the stop loss of Rs. 38550.
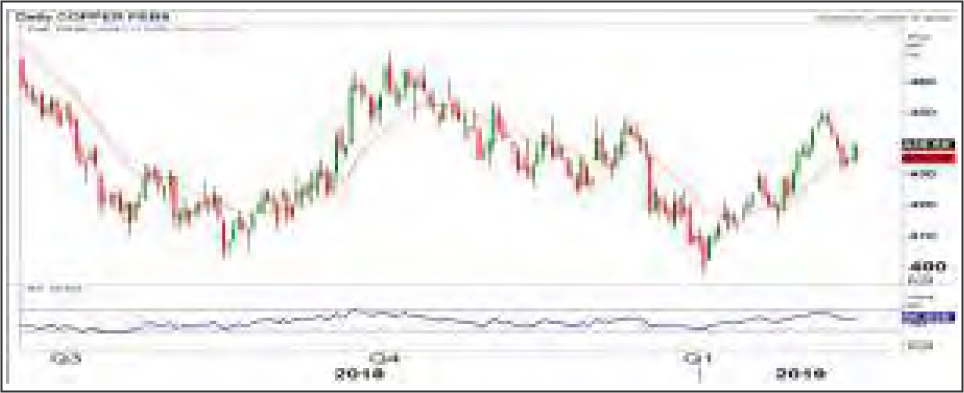
COPPER MCX (FEB) contract closed at Rs. 435.05 on 14th Feb’19. The contract made its high of Rs. 471.00 on 4th Oct’18 and a low of Rs. 397.4 on 3rd Jan’19. The 18-day Exponential Moving Average of the commodity is currently at Rs. 436.35.On the daily chart, the commodity has Relative Strength Index (14-day) value of 59.61.
One can buy at Rs. 437 for a target of Rs. 450 with the stop loss of Rs. 430.
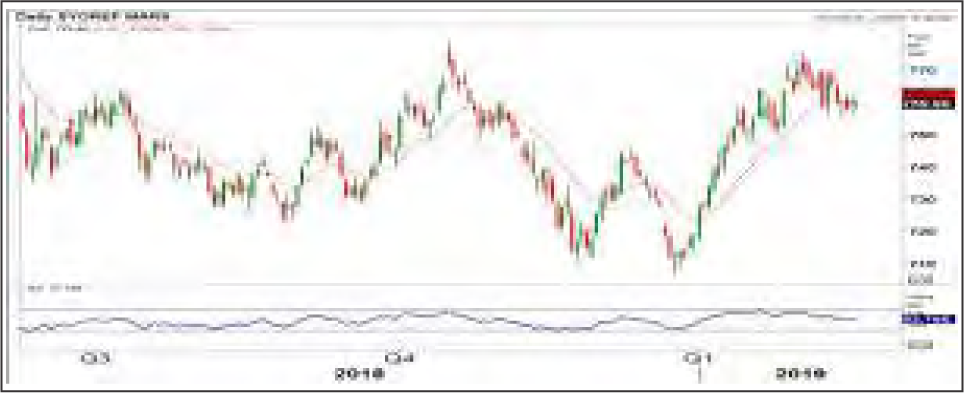
SYOREF NCDEX (MAR)contract was closed at Rs. 760.25 on 14th Feb’19. The contract made its high of Rs. 775.50 on 31st Jan’19 and a low of Rs. 700.50 on 26th Dec’18. The 18-day Exponential Moving Average of the commodity is currently at Rs. 759.23.On the daily chart, the commodity has Relative Strength Index (14-day) value of 54.867.
One can sell at Rs. 770 for a target of Rs. 750 with the stop loss of Rs 780.

11
• U.S. retail sales recorded their biggest drop in more than nine years in December.
• South Korea resumed imports of Iranian oil in January after a four-month hiatus.
• China exports of unwrought aluminium and aluminium products from China rose to 552,000 tonnes last month.
• China's iron ore imports climbed 5.3 percent in January from December supported by strong restocking demand at steel mills.
• The government hiked the minimum selling price of sugar by Rs 2 per kg to Rs 31 to help millers clear farmers' dues.
• The BSE is going to launch cotton futures on 18th February.
• MCX revised trading timings, on account of change in US daylight saving timings:Non-agri commodities (09.00 am-11.30 pm), cotton, CPO&RBD palmolein (09.00 am09.00 pm), all other agri commodities (09.00 am-05.00pm).
• Import of vegetable oils during January 2019 is reported at 1,275,259 tons compared to 1,291,141 tons in January 2018.
• India’s total soybean output standing at 11.48 million tonnes during the ongoing harvesting season as compared to 8.36 million tonnes in the previous season. - Solvent Extractors’ Association of India (SEA).
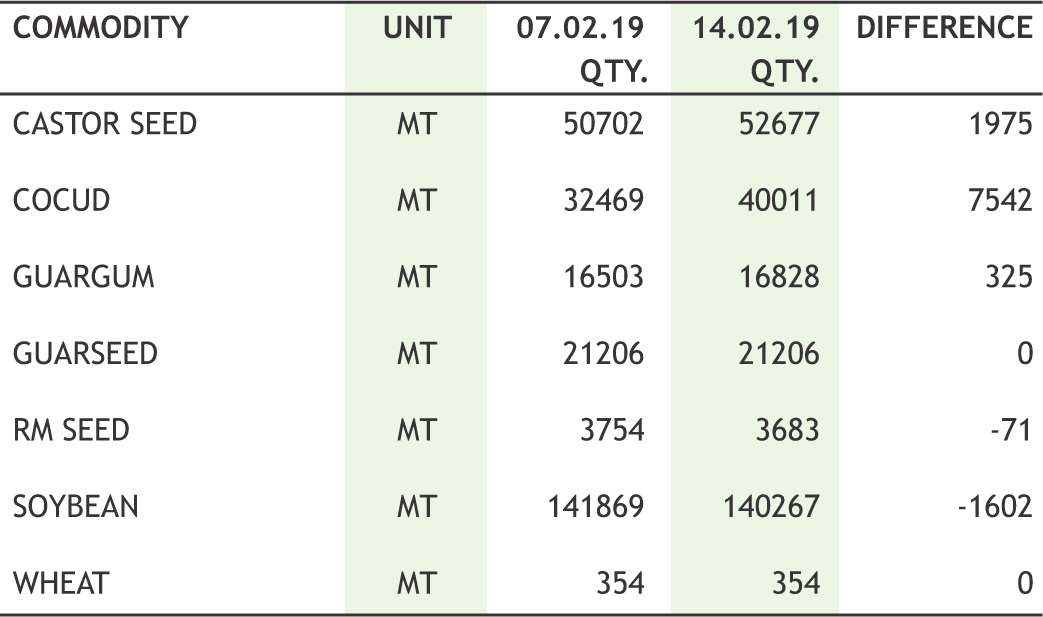
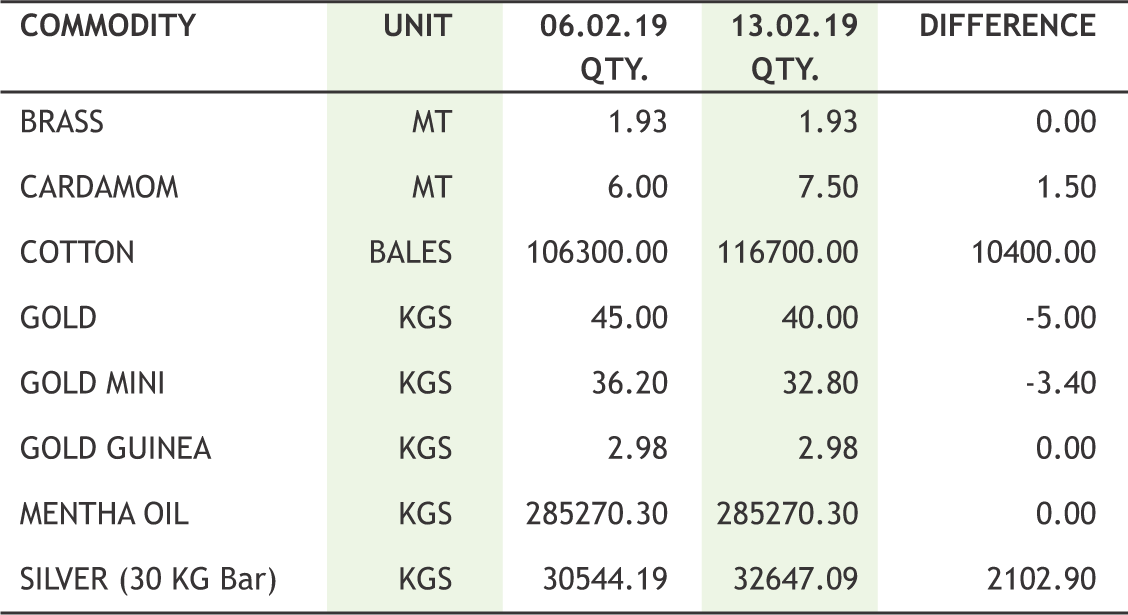
Commodities traded in ambiguity as investors were awaiting further developments from ongoing U.S.-China trade talks before making any big moves. Gold recovered its weekly lose as concerns over an economic slowdown supported prices for the safe-haven metal and a firm dollar kept a lid on gains. Gold prices have risen more than 12% since touching more than 1-1/2- year lows in mid-August, mostly on expectations of a pause in Fed rate hikes. Fresh buying witnessed in crude oil across the board. Brent crude oil prices hit 2019 highs above $65 per barrel on Friday, spurred by U.S. sanctions against Venezuela and Iran as well as OPEC-led supply cuts. The Organization of the Petroleum Exporting Countries (OPEC) and some non-affiliated suppliers including Russia are withholding supply in order to tighten the market and prop up prices. The United States expects domestic oil production to reach new heights this year and next, and that prices — for both crude and gasoline — will be lower than they were in 2018. Base metal prices retreated from higher side on slowdown issues in China. Copper prices declined for a fifth day in a row on Thursday despite trade data showing Chinese imports of the orange metal growing at a record-setting pace. Copper has declined by 17% from its June 2018 high over worries of a slowdown in China and the impact of a trade war with the US, but the longer term prospects for the metal remain rosy. Zinc fell, hitting its lowest in more than two weeks as the dollar held at a two-month high. Some agri commodities saw good move in the week gone by. Soyabean traded down both in domestic and US market. US soybean futures slumped to a threeweek low as fears of a delayed resolution in US-China trade talks. China, January import data showed a sharp fall (13%) in soybean imports compared to the same period last year from US. Cotton counter traded mix. The market is now awaiting the outcome of US-China trade talk. Expiry is in progress and rollover is taking place from March to May, contract price may remain volatile. Mentha traded up, farmers are now worried as untimely rains and inclement weather conditions have delayed the sowing in key producing belts. The production is likely to be badly affected if weather conditions don't improve in the next few days. Guar counter saw good recovery. It was a good week for spices, where we witnessed buying everywhere.

|

|

12

|
|
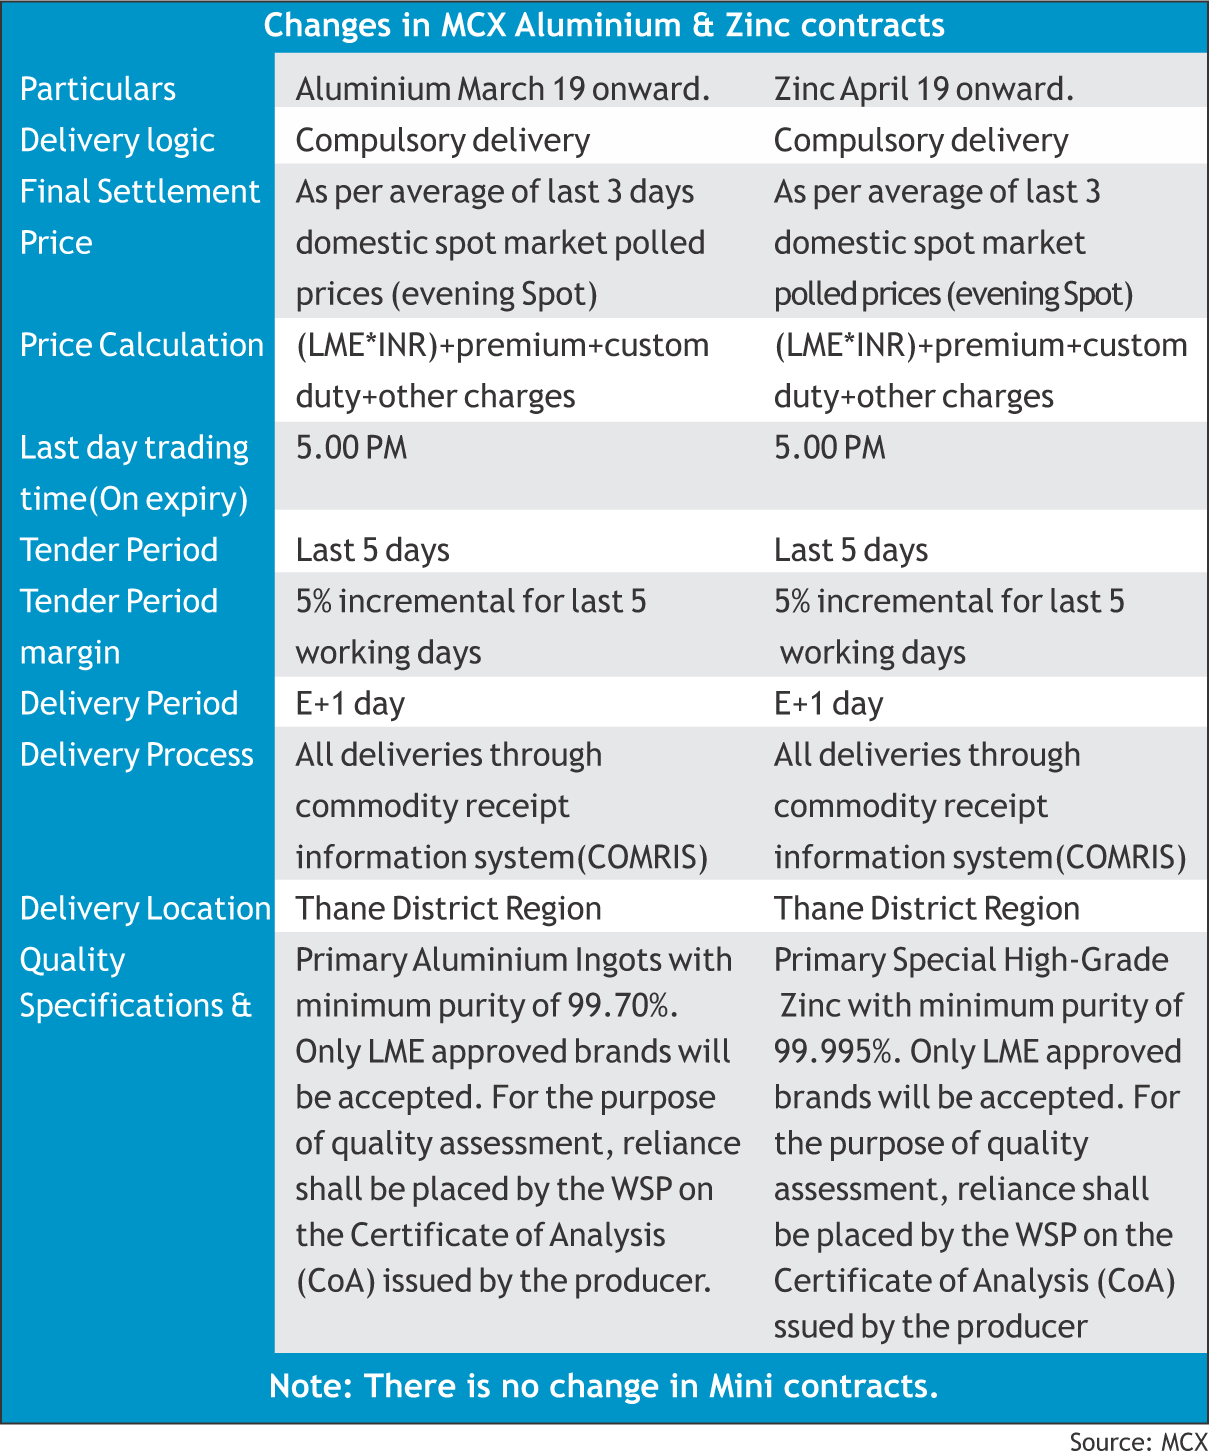
As of now, all metals contracts (except gold and silver) and all energy contracts are settled in cash, which means at the end, the difference between contract purchase and settlement price is settled in cash but without delivery. Now Sebi has been emphasizing on physical delivery settlement because as Sebi wants to reduce the distinction between cash market and derivative market to control speculation & volatility in the market. India has been producing these commodities. So, physical settlement can be done in India. If contracts have to be settled by delivery, domestic prices will be needed. Till now, the settlement price for most metals contracts is derived from the London Metal Exchange, the benchmark of these commodities.
Benefit of compulsory delivery
• The main benefit of having compulsory delivery is that it will curb excessive speculation.
• Another benefit of having compulsory delivery will be that as of now the cash settlement of commodity contracts is based on LME prices. But now in Zinc and Aluminium they will be based on local prices and also factor in taxes, freight and warehousing costs.
• Commodity derivatives are also hedging tool for those holding actual commodity, while speculators who traded without holding the underlying commodity impart liquidity to the counter by taking on the risk of the hedger.
|


13

|
| 11th FEB | RBI won't transfer past reserves demanded by finance ministry for now. |
| 12th FEB | Euro zone ministers approved Lane as next ECB chief economist. |
| 19th FEB | BoE would pump in emergency money after no-deal Brexit, says minister. |
| 12th FEB | U.S. lawmakers reached tentative deal to avoid government shutdown. |
| 13th FEB | IIP growth slumped to 2.4% in Dec on weak manufacturing. |
| 13th FEB | Indian CPI hit 19-month low of 2.05% in January on easing food prices. |
| 13th FEB | UK's May seek more time to find Brexit deal, tells lawmakers |
| 14th FEB | RBI turned net buyer of dollar in December after almost 9 months. |
| 14th FEB | Fed's Mester sees limited inflation risk from rising wages. |
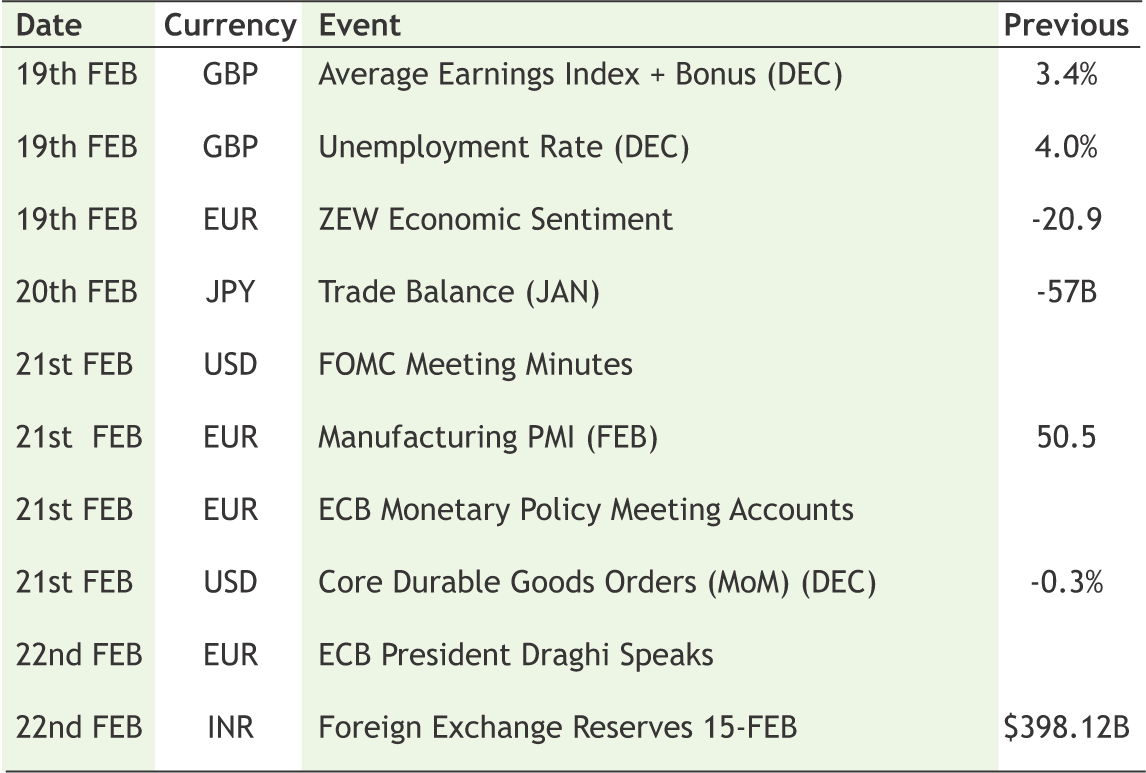
Rupee appreciated in first couple of days of the week after better than expected IIP’s released on Tuesday but majority of this appreciation was trimmed in later two days after buying from importers was witnessed. The narrowing down of interest rates in India and US creates a scenario of pulling out investments by FII’s and FPI’s, hence making a case of further depreciation in rupee. The slow and steady rise in crude oil prices also creates pressure on rupee. RBI also turned net buyer in dollar in December and the occasion happened after almost 9 months. Meanwhile on the cross currency front, dollar strengthened against Euro, sterling and Yen on growing global economy crisis where weak economic numbers were seen across the globe and safe haven buying for dollar took place. The improved manufacturing activity in India and stabilizing political activity could keep rupee depreciation in check. Next week, some important events from international markets like Brexit issue and US-China trade war escalation will keep track of markets but the lack of events from domestic markets and truncated week from US in observance of President’s day can keep the markets in a range. Expect USDINR to stay above 71 and move higher towards 72.20.
|
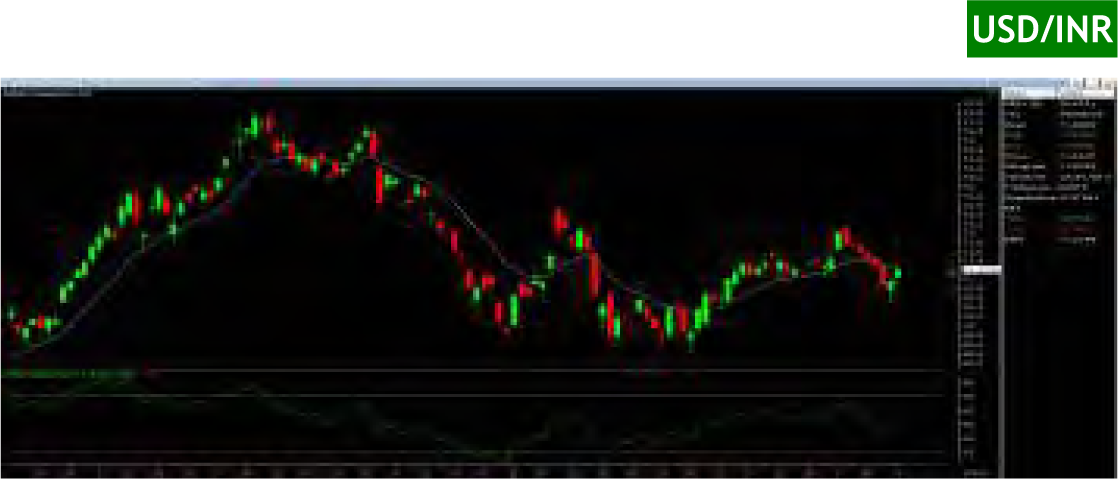
USD/INR (FEB) contract closed at 71.2125 on 14th Feb’ 19. The contract made its high of 71.45 on 11th Feb’19 and a low of 70.5025 on 13th Feb’ 18 (Weekly Basis). The 14-day Exponential Moving Average of the USD/INR is currently at 71.27
On the daily chart, the USD/INR has Relative Strength Index (14-day) value of 48.10. One can buy at 71.04 for the target of 71.64 with the stop loss of 70.74.

EUR/INR (FEB) contract closed at 80.4075 on 14th Feb’ 19. The contract made its high of 80.98 on 11th Feb’19 and a low of 79.9225 on 12th Feb’19 (Weekly Basis). The 14-day Exponential Moving Average of the EUR/INR is currently at 81.05
On the daily chart, EUR/INR has Relative Strength Index (14-day) value of 37.74. One can sell at 80.75 for a target of 80.15 with the stop loss of 81.05.

GBP/INR (FEB) contract closed at 93.2375 on 14th Feb’ 19. The contract made its high of 92.5350 on 11th Feb’19 and a low of 91.0725 on 12th Feb’18 (Weekly Basis). The 14-day Exponential Moving Average of the GBP/INR is currently at 92.29
On the daily chart, GBP/INR has Relative Strength Index (14-day) value of 42.35. One can buy above 91.60 for a target of 92.20 with the stop loss of 91.30.
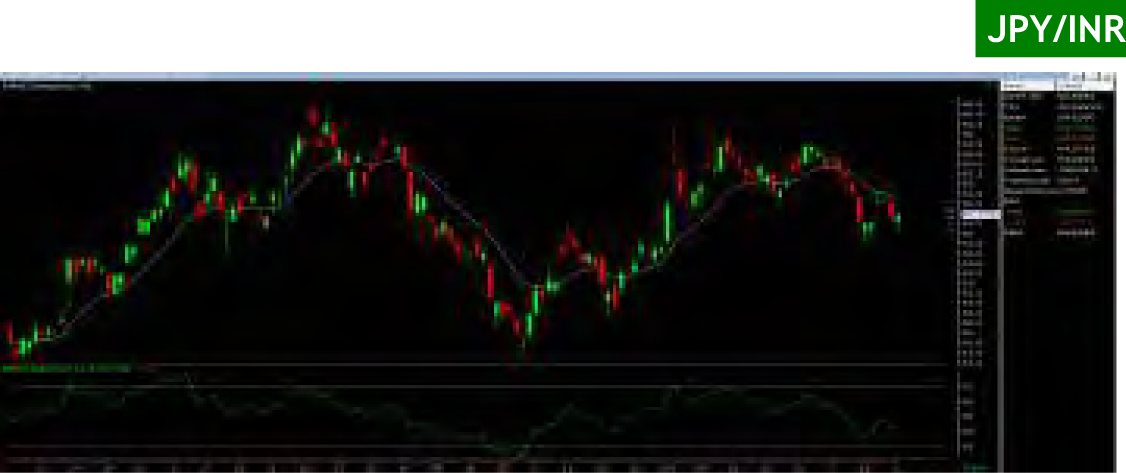
JPY/INR (FEB) contract closed at 65.44 on 14th Feb’ 19. The contract made its high of 65.0325 on 11th Feb’19 and a low of 63.80 on 13th Feb’19 (Weekly Basis). The 14-day Exponential Moving Average of the JPY/INR is currently at 64.86
On the daily chart, JPY/INR has Relative Strength Index (14-day) value of 34.10. One can buy at 64.25 for a target of 64.85 with the stop loss of 63.95.

14
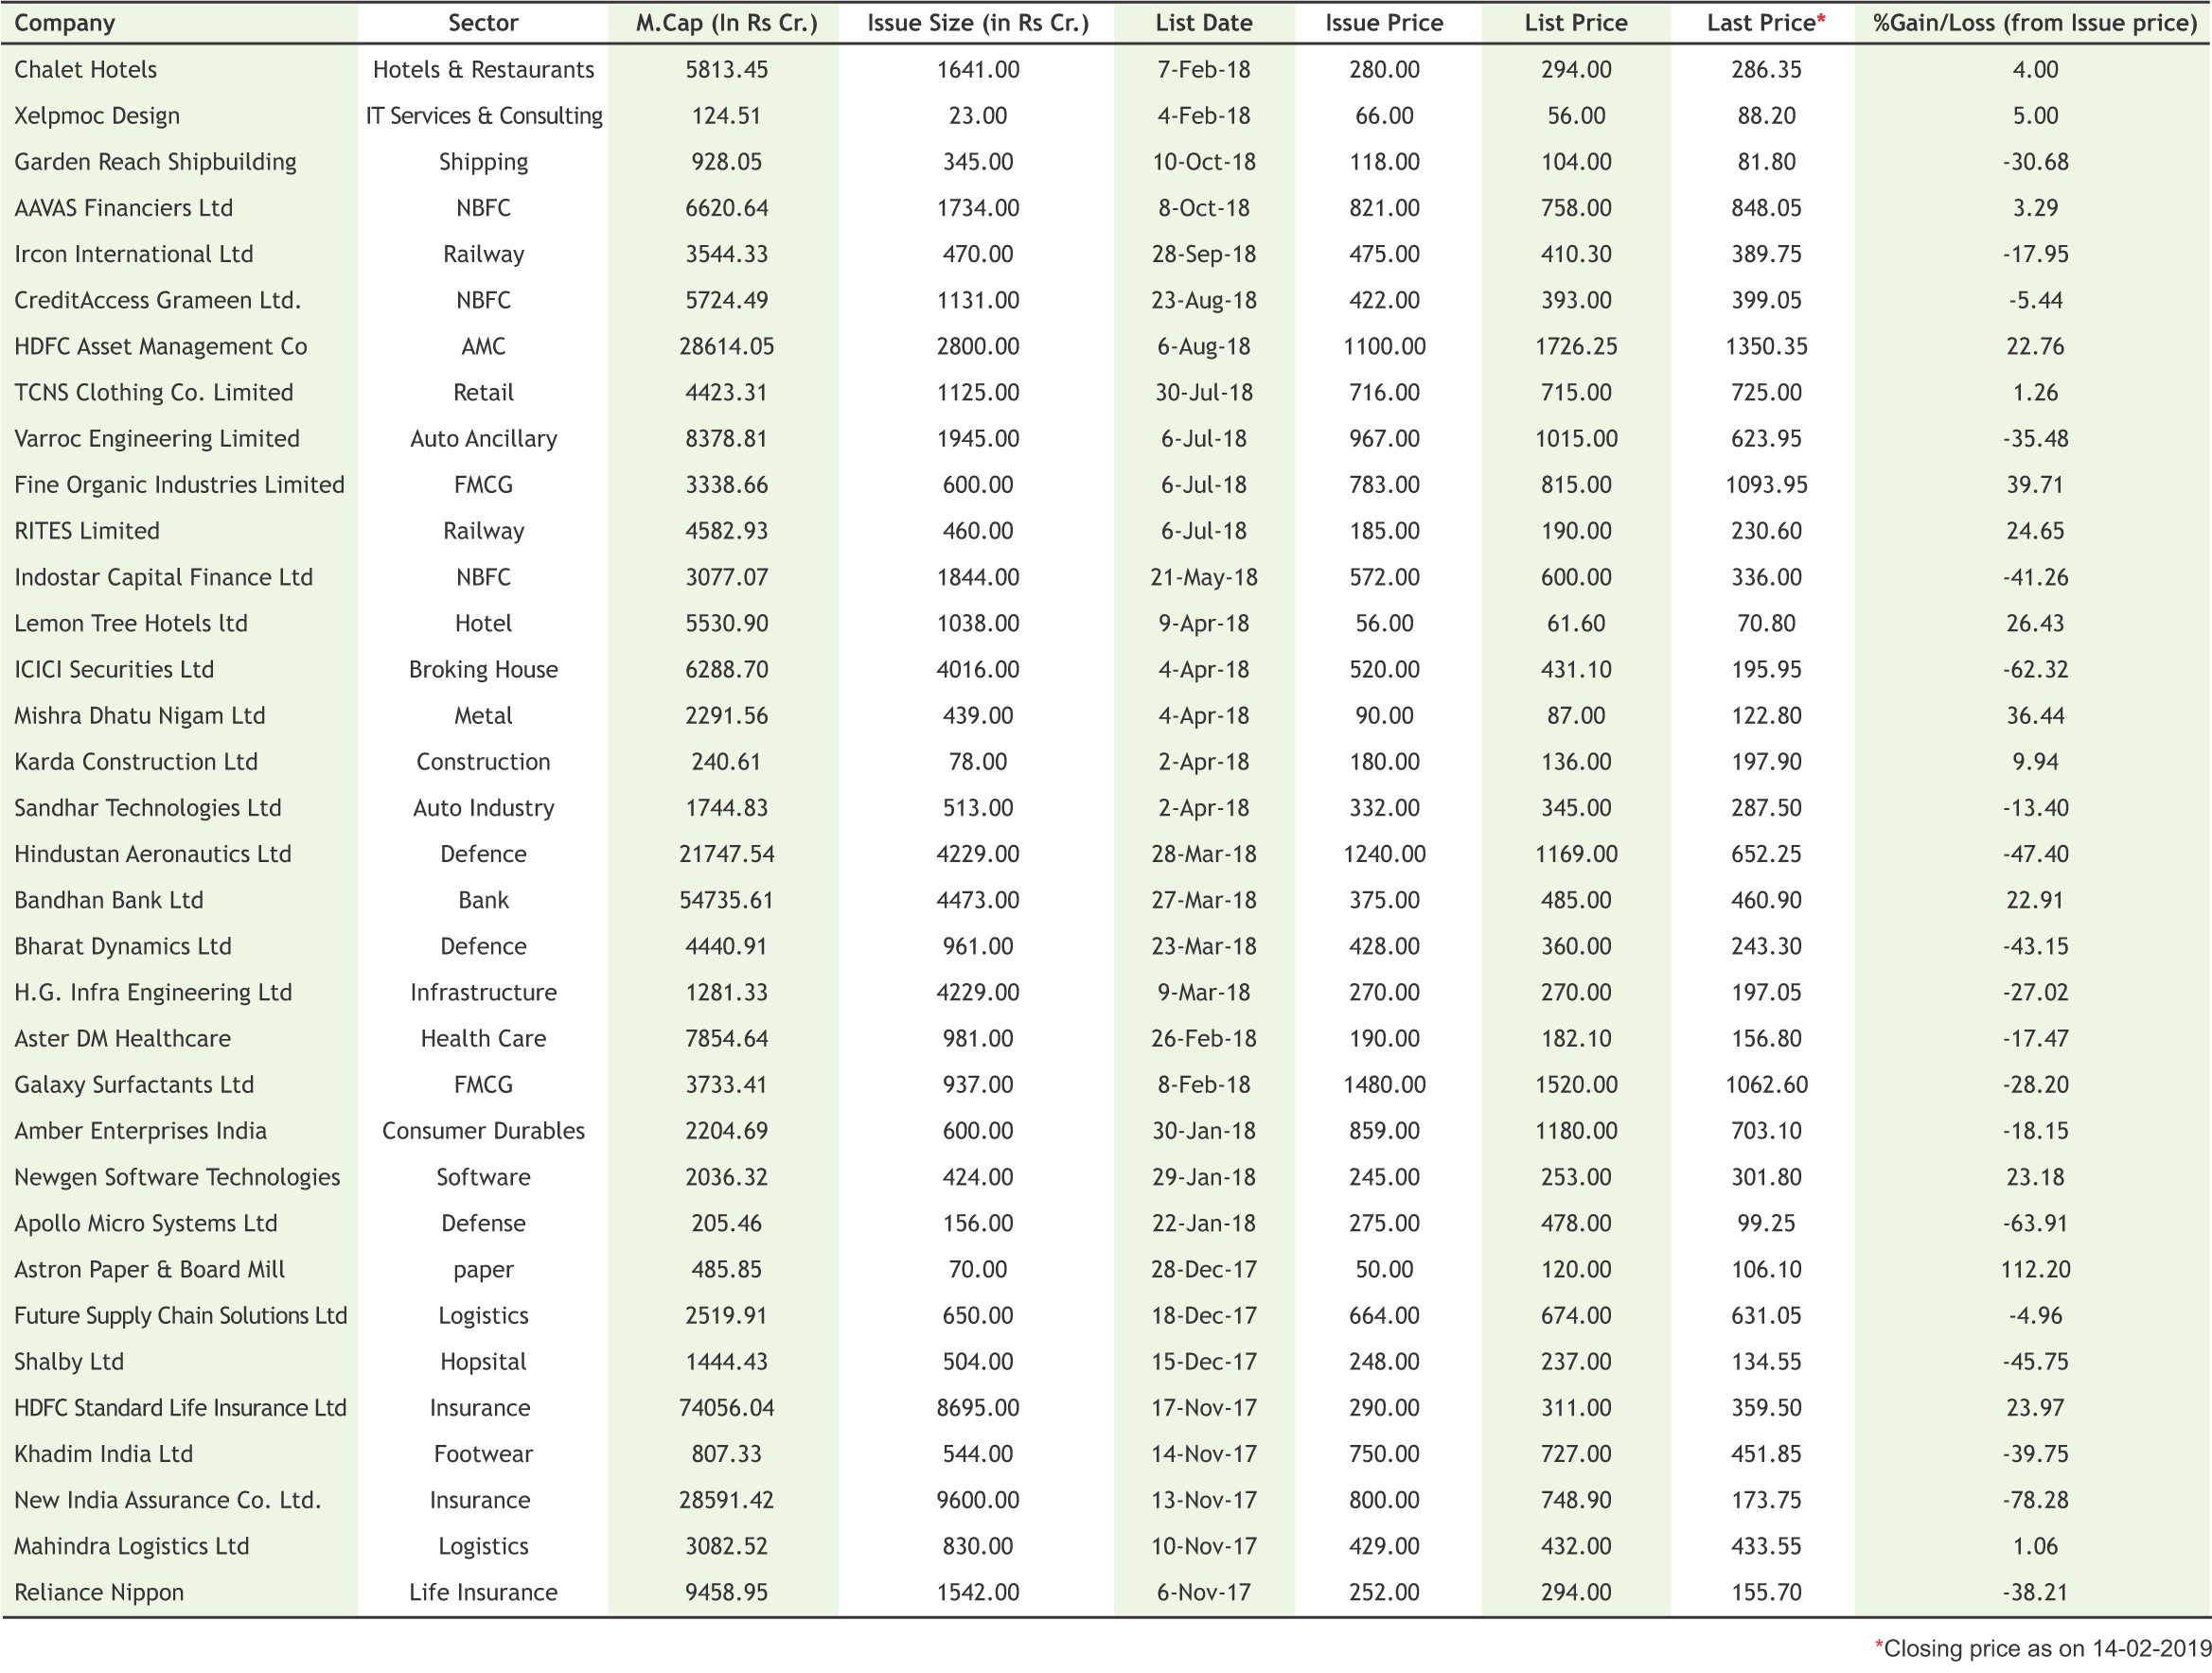
Neogen Chemicals gets Sebi's go ahead for IPO
Neogen Chemicals, which had filed its IPO papers with Sebi in November last year, obtained the regulator's "observations" on February 8, latest update available with the capital markets watchdog showed. Sebi observation is necessary for any company planning to launch public issues. Going by the draft papers, Neogen Chemicals' initial share sale comprises fresh issuance of shares aggregating up to Rs 70 crore and an offer for sale of up to Rs 29 lakh by the company's promoters. The company is a leading manufacturer of bromine-based and lithium-based specialty chemicals. Proceeds of the issue will be utilised towards repayment of certain borrowings availed by the company, long-term working capital, and for general corporate purposes. "Our company expects to receive the benefits of listing of equity shares on stock exchanges, including among other things, enhancing the visibility of our brand and company," as per the draft papers. Inga Advisors and Batlivala & Karani Securities India will manage the company's initial public offer (IPO). The equity shares are proposed to be listed on BSE and NSE.
Reliance General Insurance files for IPO
India's Reliance General Insurance Co has filed for an initial public offering (IPO) consisting of a fresh issue of shares worth up to 2 billion rupees ($28.15 million). The IPO will also include an offer by Reliance Capital to sell up to 79.5 million shares, Reliance Capital said. The private sector insurer has appointed Motilal Oswal Investment Advisors Ltd, CLSA India Pvt Ltd and Credit Suisse Securities (India) Pvt Ltd as the global coordinators and book running lead managers to the issue. Haitong Securities India Pvt Ltd, IndusInd Bank Ltd and YES Securities (India) Ltd are the book running lead managers.
|

15
|
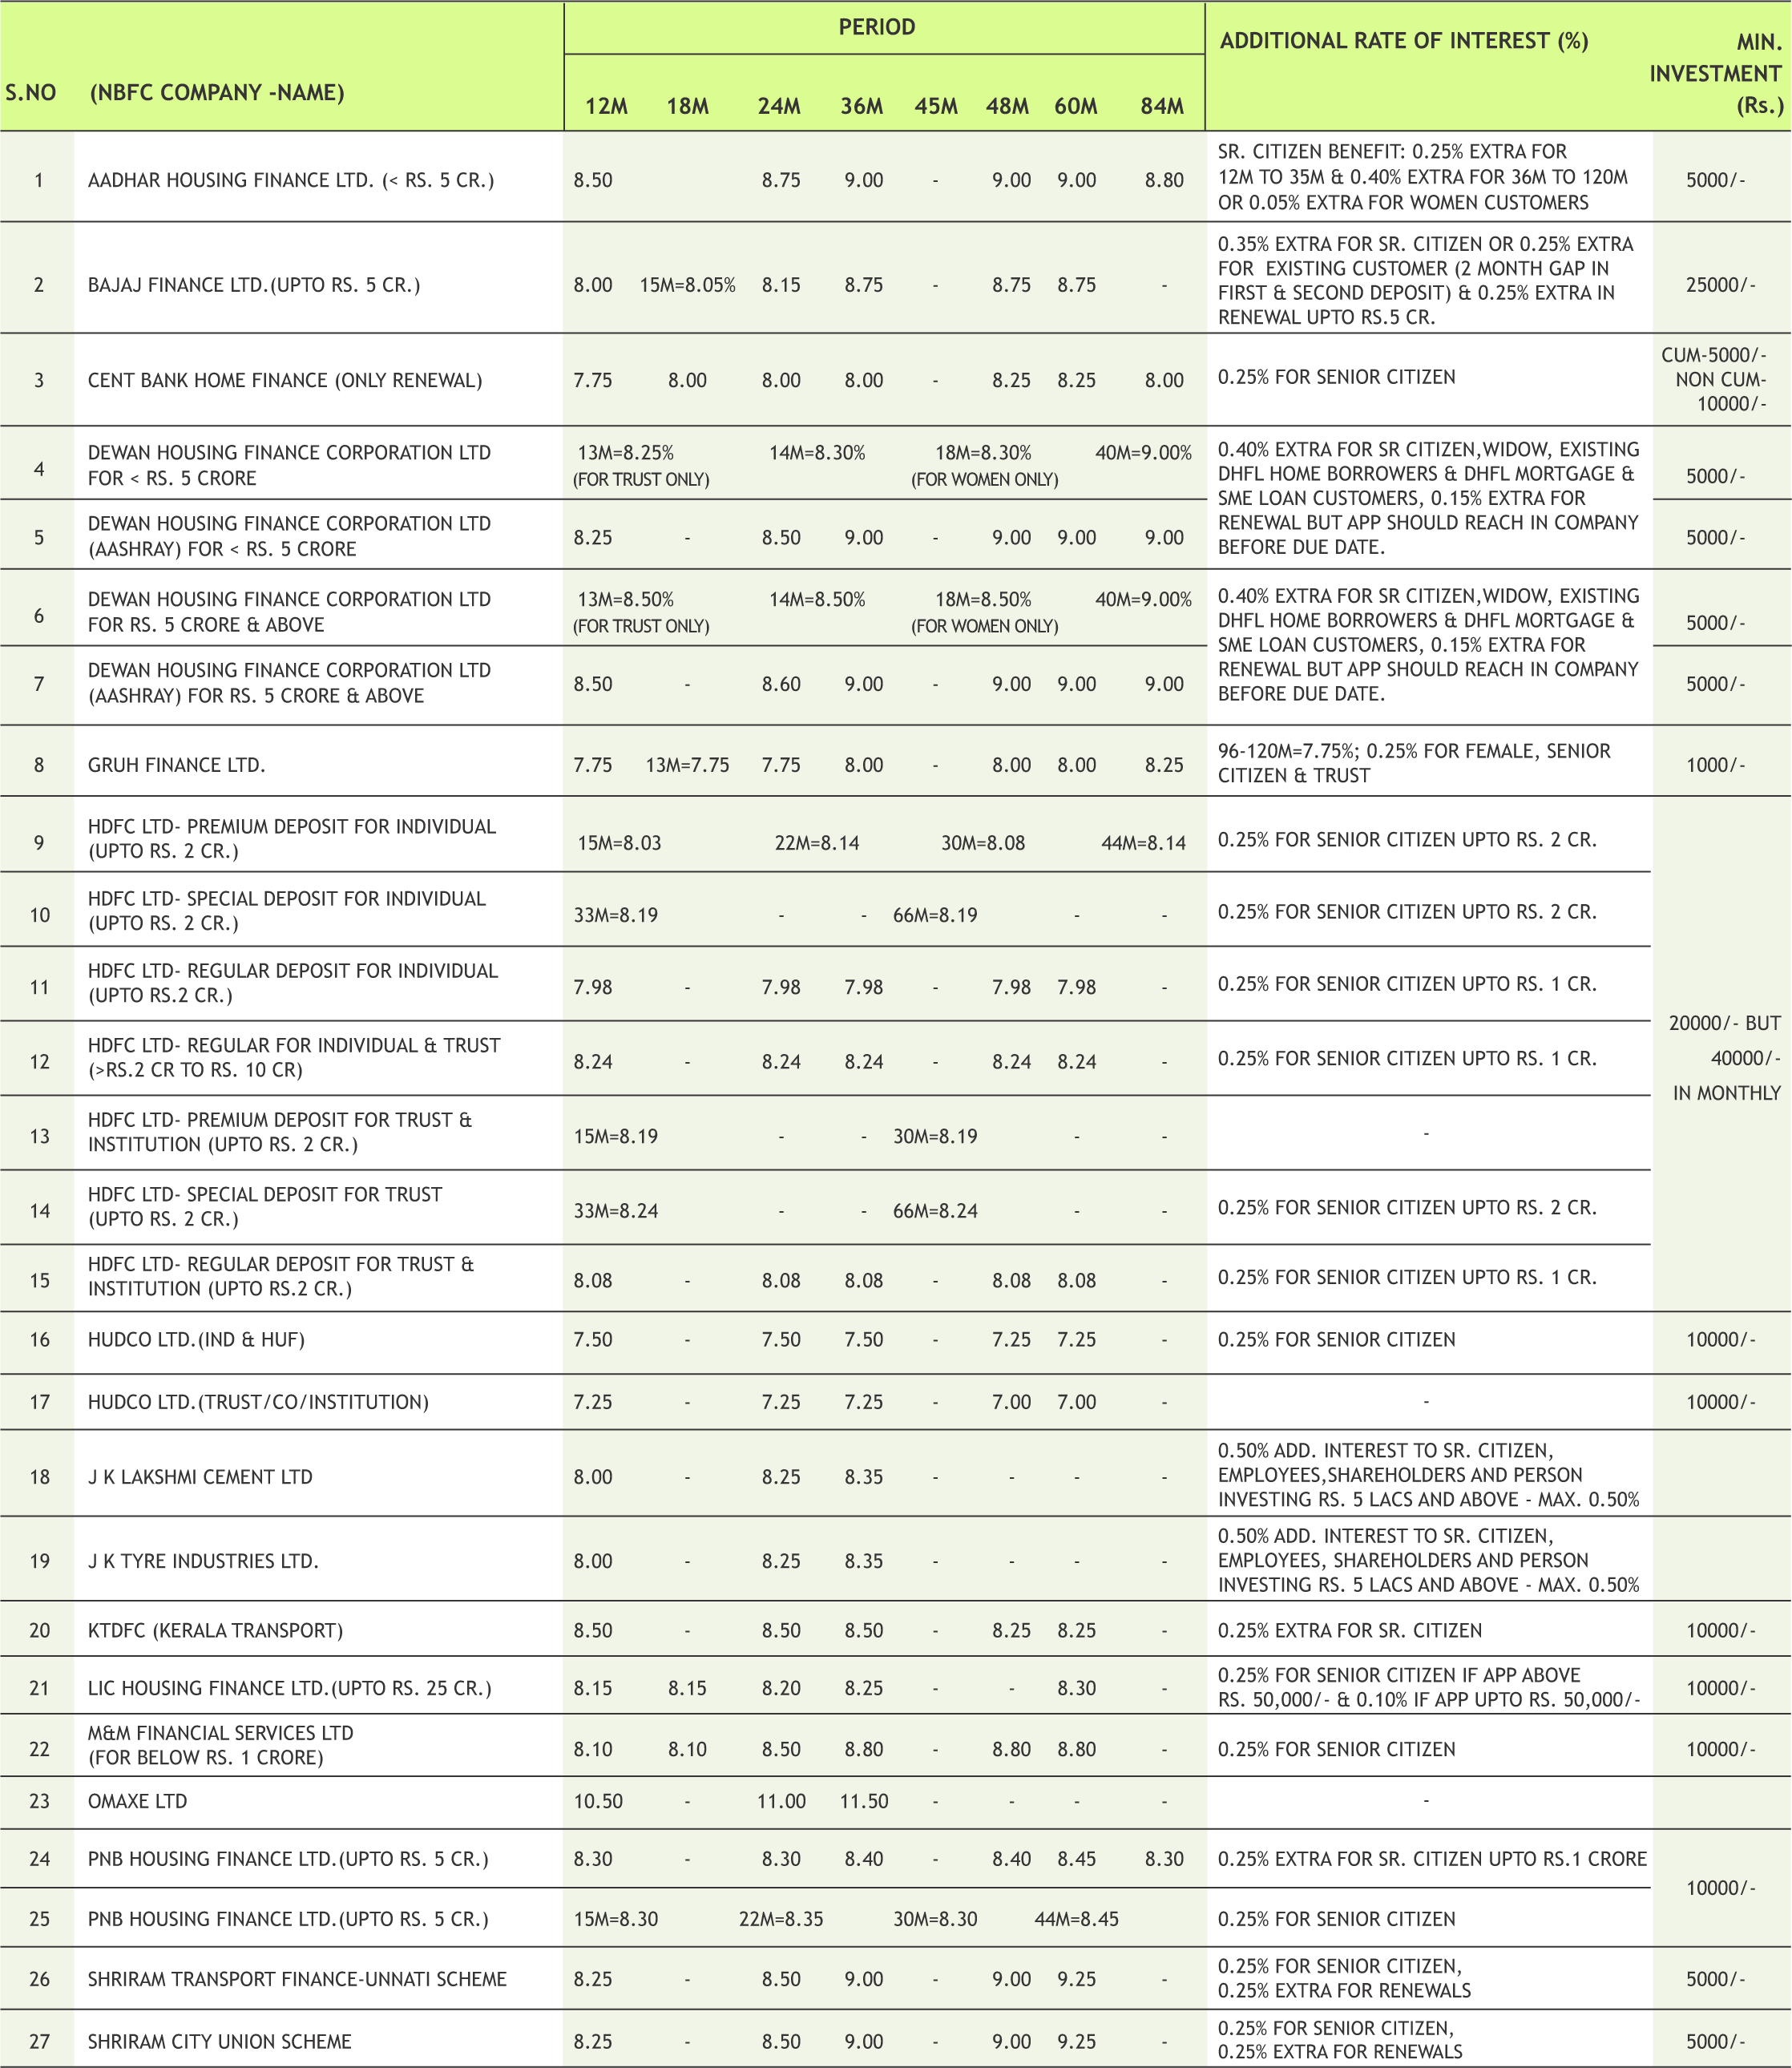
* Interest Rate may be revised by company from time to time. Please confirm Interest rates before submitting the application.
* For Application of Rs.50 Lac & above, Contact to Head Office.
* Email us at fd@smcindiaonline.com


16
Net inflow in Equity MF hit 24-month low
According to media reports, net inflow of investments in equity and equity linked savings scheme plunged 6.7% to a 24-month low from Rs. 6,606 crore in Dec 2018 to Rs. 6,158 crore in Jan 2019. The persistent volatility in the domestic equity market, political uncertainty ahead of elections and overall global economic slowdown weighed on investors’ sentiment. However, the inflow of retail investment stood steady
AMFI reports 2.2% rise in asset base in Jan 2019
The Association of Mutual Fund in India (AMFI) reported data for Jan 2019 with the asset under management (AUM) of the mutual fund industry increasing 2.2% from Rs. 22.86 lakh crore in Dec 2018 to Rs. 23.37 lakh crore in Jan 2019. This was led by the net inflow of Rs. 0.59 lakh crore from liquid schemes and Rs. 6,158 crore from equity and equity linked savings scheme.
ICICI Prudential Mutual Fund launched ICICI Prudential Retirement Fund
According to media reports, ICICI Prudential MF has launched ICICI Prudential Retirement Fund, which is an open-ended solution-oriented scheme with a lock-in period of 5 years or till the retirement age. The scheme provides four options: pure equity plan, hybrid aggressive plan, hybrid conservative plan and pure debt plan.

17

|

|

|

|

|
Note:Indicative corpus are including Growth & Dividend option . The above mentioned data is on the basis of 08/08/2019 Beta, Sharpe and Standard Deviation are calculated on the basis of period: 1 year, frequency: Weekly Friday, RF: 7%
*Mutual Fund investments are subject to market risks, read all scheme related documents carefully

17

Mr. D K Aggarwal (CMD, SMC Investments & Senior VP – PHD Chamber of Commerce) during a Call on Meeting with Shri Sunil Arora, Chief Election Commissioner of India held on 10th December, 2018 at Nirvachan Sadan, Janpath, New Delhi.
Mr. Ajay Garg (CEO & Director SMC Global Securities Ltd) along with Mr. Naveen Gupta (President, ICAI and Independent Director on SMC’s Board) on Friday, 8th February, 2019 at ICAI Office, New Delhi.
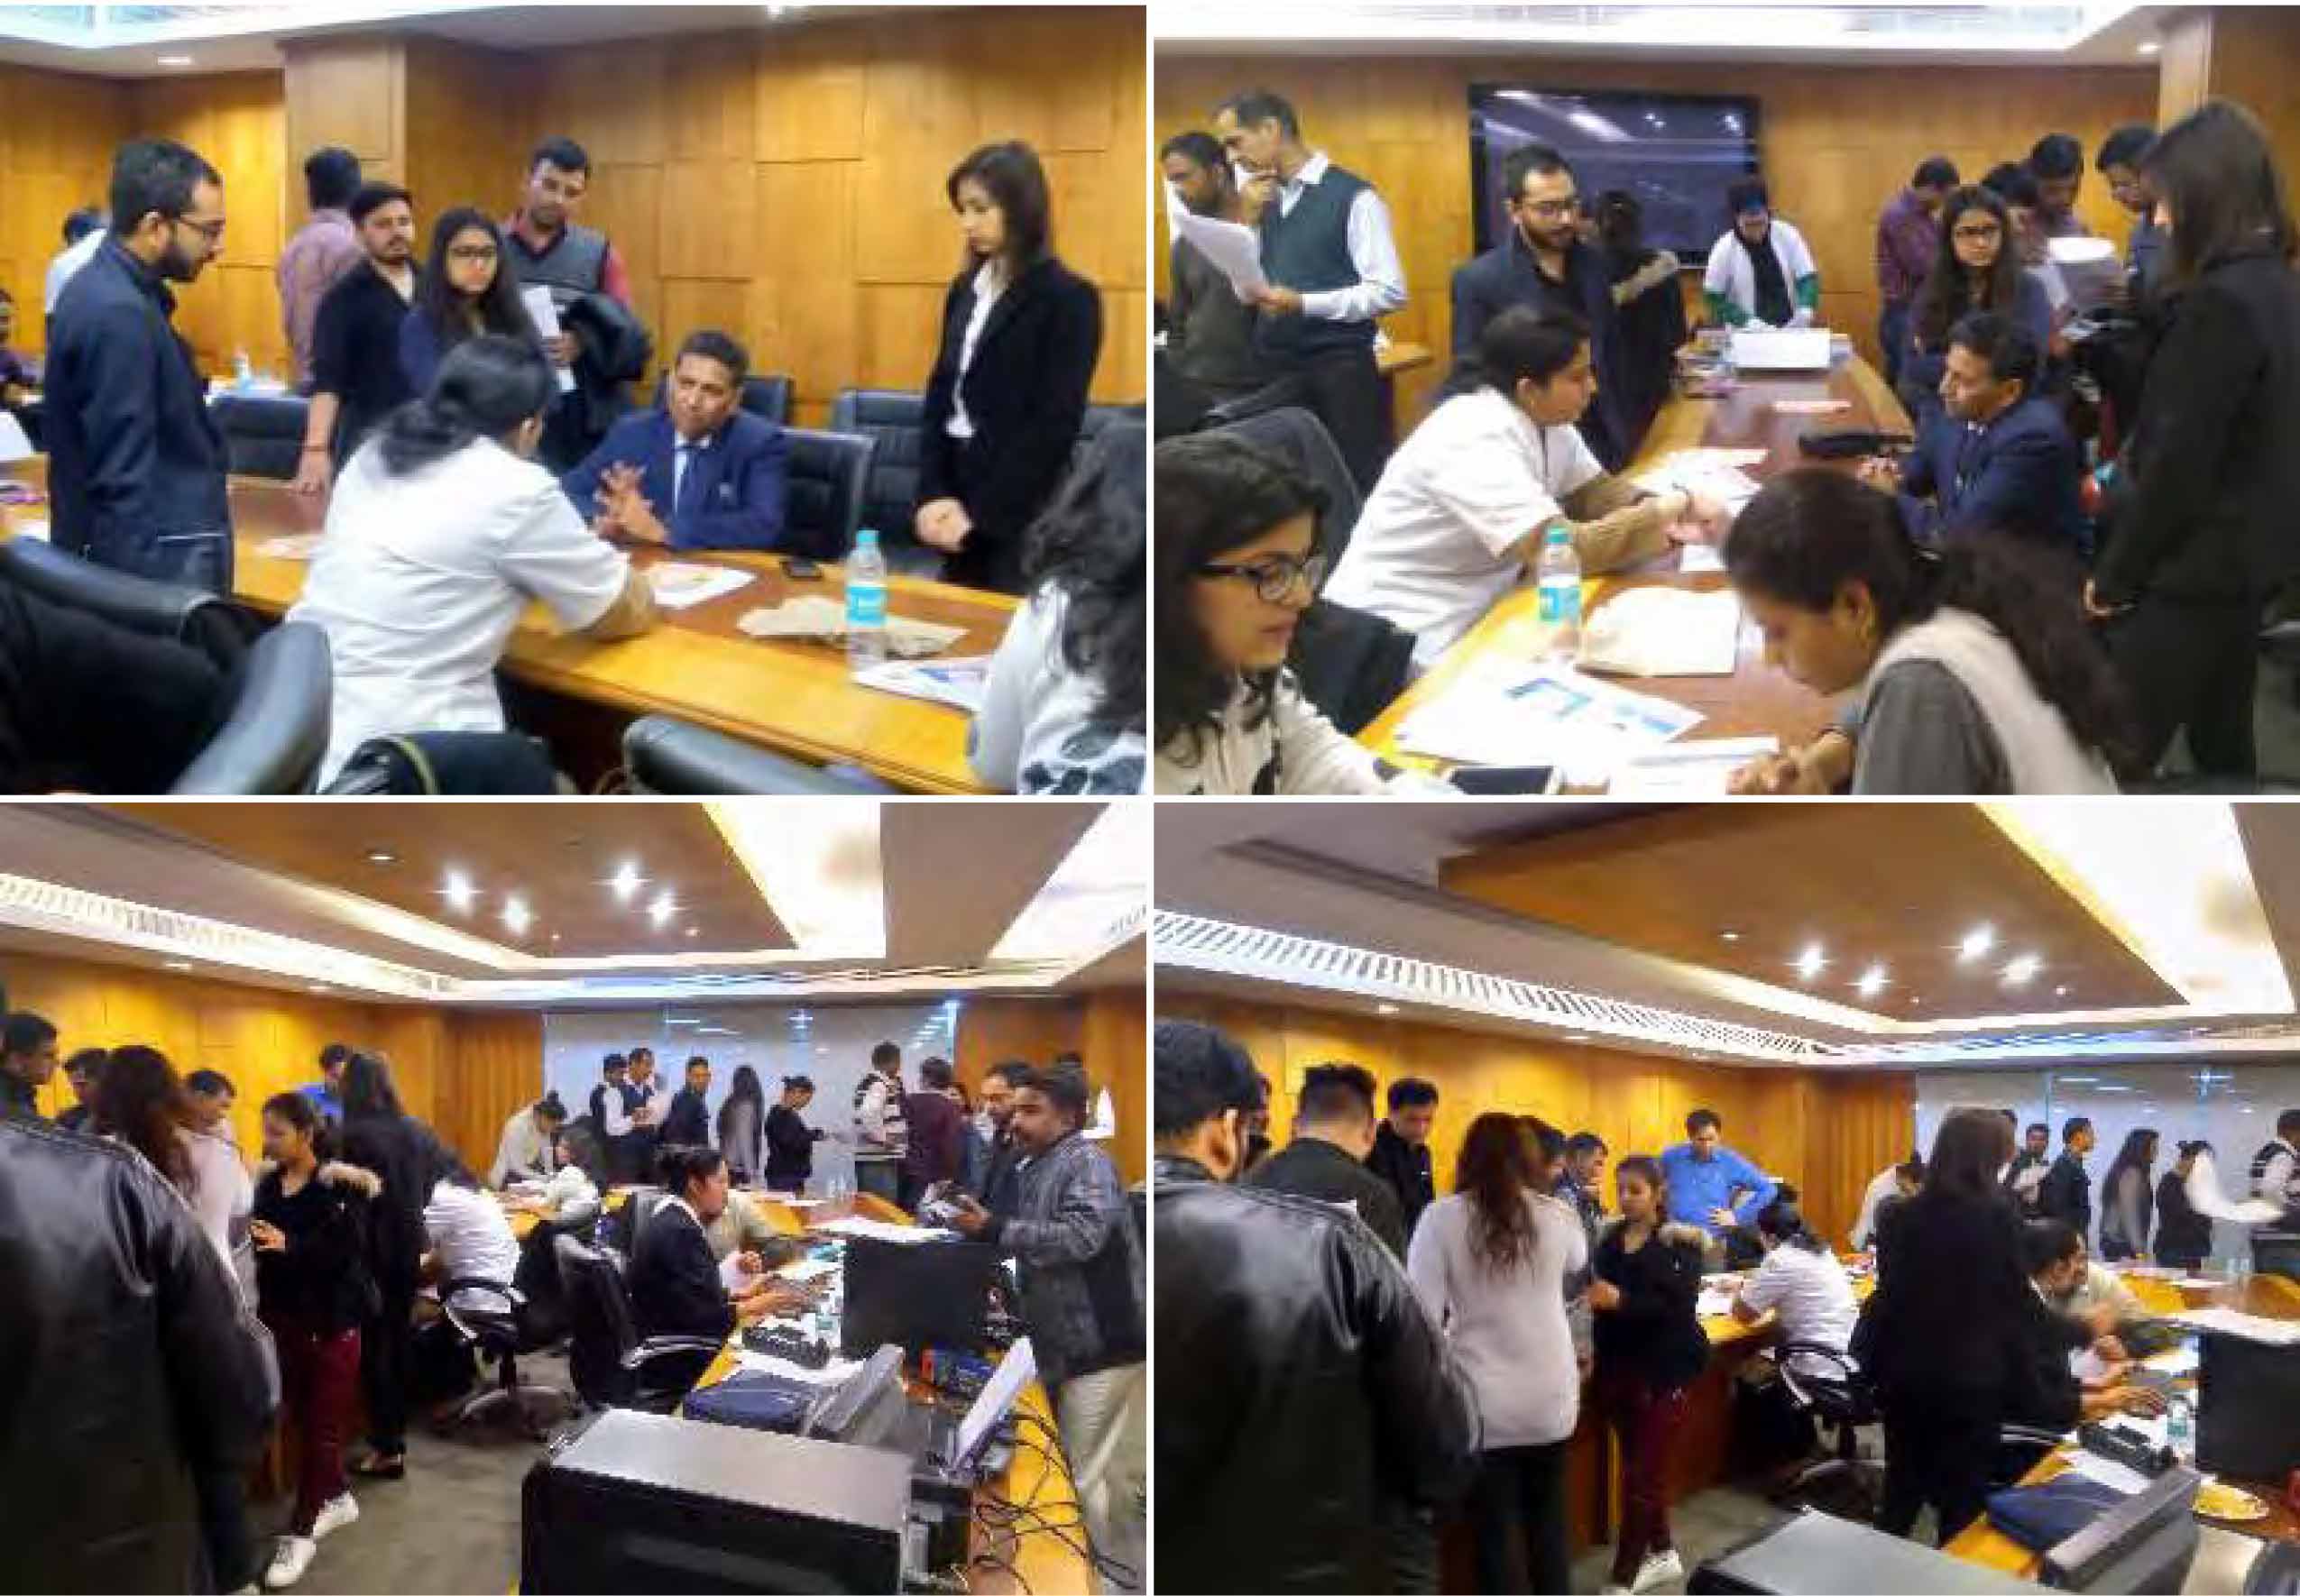
SMC organised Health Camp for its employees held on 15th & 16th February, 2019 at SMC Head Office, New Delhi.
www.smcindiaonline.com

REGISTERED OFFICES:
11 / 6B, Shanti Chamber, Pusa Road, New Delhi 110005. Tel: 91-11-30111000, Fax: 91-11-25754365
MUMBAI OFFICE:
Lotus Corporate Park, A Wing 401 / 402 , 4th Floor , Graham Firth Steel Compound, Off Western Express Highway, Jay Coach Signal, Goreagon (East) Mumbai - 400063
Tel: 91-22-67341600, Fax: 91-22-67341697
KOLKATA OFFICE:
18, Rabindra Sarani, Poddar Court, Gate No-4,5th Floor, Kolkata-700001 Tel.: 033 6612 7000/033 4058 7000, Fax: 033 6612 7004/033 4058 7004
AHMEDABAD OFFICE :
10/A, 4th Floor, Kalapurnam Building, Near Municipal Market, C G Road, Ahmedabad-380009, Gujarat
Tel : 91-79-26424801 - 05, 40049801 - 03
CHENNAI OFFICE:
Salzburg Square, Flat No.1, III rd Floor, Door No.107, Harrington Road, Chetpet, Chennai - 600031.
Tel: 044-39109100, Fax -044- 39109111
SECUNDERABAD OFFICE:
315, 4th Floor Above CMR Exclusive, BhuvanaTower, S D Road, Secunderabad, Telangana-500003
Tel : 040-30031007/8/9
DUBAI OFFICE:
2404, 1 Lake Plaza Tower, Cluster T, Jumeriah Lake Towers, PO Box 117210, Dubai, UAE
Tel: 97145139780 Fax : 97145139781
Email ID : pankaj@smccomex.com
smcdmcc@gmail.com
Printed and Published on behalf of
Mr. Saurabh Jain @ Publication Address
11/6B, Shanti Chamber, Pusa Road, New Delhi-110005
Website: www.smcindiaonline.com
Investor Grievance : igc@smcindiaonline.com
Printed at: S&S MARKETING
102, Mahavirji Complex LSC-3, Rishabh Vihar, New Delhi - 110092 (India) Ph.: +91-11- 43035012, 43035014, Email: ss@sandsmarketing.in