2020: Issue 735, Week: 11th - 15th May

A Weekly Update from SMC (For private circulation only)


WISE MNEY

Customized Plans

Comprehensive Investment Solutions

Long-term Focus

Independent & Objective Advise

Financial Planning


Call Toll-Free 180011 0909

Visit www.smcindiaonline.com

Contents


From The Desk Of Editor

I

n the week gone by, global market traded with mixed sentiments as investors I weighed news on economies reopening and U.S.-China trade developments against data highlighting the damage caused by the coronavirus. Trade war clouds between US and China once again looming on the horizon. However, the United States and China in January reached a truce in their lengthy trade war when the two economic superpowers signed a "phase one" agreement. But Trump's recent comments suggest that trade tensions could return. The world is confused and panicked about Covid-19. The International Monetary Fund has said countries around the world should use the novel coronavirus pandemic as an opportunity to invest in public infrastructure and other projects that take advantage of low interest rates.

Back at home, domestic markets witnessed volatile movement as rising cases of COVID-19 and a delay in government stimulus amid US-China trade tensions dealt a blow to investors' sentiment. There is a buzz that the government is working on a comprehensive financial package not only for MSMEs but for all sectors of the economy. If government announces such measures, it would surely uplift of the markets going forward. Furthermore, India is likely to continue export incentives worth Rs 40,000 crore till next year as the government looks to cushion the impact of Covid-19 on the country’s outward shipments. Rupee too plunged against the US dollar due to growth concerns as a survey showed that the services sector contracted in April. India's services activity suffered a shock collapse in April as the coronavirus lockdown crippled global demand, causing a historic spike in layoffs and reinforcing fears of a deep recession in Asia's third-largest economy. On the data front, output at India’s core sector contracted by 6.5% in March reflecting the early impact of the COVID-19 pandemic and the subsequent nationwide lockdown. Going forward, Investors will continue to monitor developments on the global coronavirus virus pandemic, as concerns over the virus’ economic impact have been continuously deteriorating the sentiment of investors. Besides, movement of Currency, inflow and out flow of foreign fund, macroeconomic data and crude oil prices will continue to dictate the trend of the market going forward.

On the commodity market front, some recovery was witnessed in commodities in past few weeks. Market players are cautiously optimistic with lockdown measures continue to be loosened in major economies, leading to slow but steady increases in demand in the world. Crude prices saw good jump in the prices and WTI slowly crawled towards $25 after many weeks. Gold seems likely to run higher as disastrous economic data will likely only lead to further global monetary easing. It may trade in a range of 46900-45500 levels. Volatility will remain the watchword, but there is an increasing sense that the worst is behind the industry, at this point and thus base metals is also trying to make a base. Copper, zinc and nickel are looking promising. Many mandies are closed and thus the agri futures lacking some momentum, nevertheless oil seeds and spices are in action and may see more upside move. Crude should stay in wide range of 1750-2200. GDP of UK, Euro area and Germany, Interest rate of New Zealand, Unemployment of Australia, New Yuan Loans of China, Retail Sales and Michigan Consumer Sentiment of US are important triggers for this week.


(Saurabh Jain)


SMC Global Securities Ltd. (hereinafter referred to as “SMC”) is a registered Member of National Stock Exchange of India Limited, Bombay Stock Exchange Limited and its associate is member of MCX stock Exchange Limited. It is also registered as a Depository Participant with CDSL and NSDL. Its associates merchant banker and Portfolio Manager are registered with SEBI and NBFC registered with RBI. It also has registration with AMFI as a Mutual Fund Distributor.

SMC is a SEBI registered Research Analyst having registration number INH100001849. SMC or its associates has not been debarred/ suspended by SEBI or any other regulatory authority for accessing /dealing in securities market.

SMC or its associates including its relatives/analyst do not hold any financial interest/beneficial ownership of more than 1% in the company covered by Analyst. SMC or its associates and relatives does not have any material conflict of interest. SMC or its associates/analyst has not received any compensation from the company covered by Analyst during the past twelve months. The subject company has not been a client of SMC during the past twelve months. SMC or its associates has not received any compensation or other benefits from the company covered by analyst or third party in connection with the research report. The Analyst has not served as an officer, director or employee of company covered by Analyst and SMC has not been engaged in market making activity of the company covered by Analyst.

The views expressed are based solely on information available publicly available/internal data/ other reliable sources believed to be true.

SMC does not represent/ provide any warranty express or implied to the accuracy, contents or views expressed herein and investors are advised to independently evaluate the market conditions/risks involved before making any investment decision.

EQUITY


NEWS

DOMESTIC NEWS

Economy

• According to a survey results from IHS Markit, India's service sector logged its record fall in April as measures to stem the spread of the coronavirus caused output and demand to fall at unprecedented rates. The services Purchasing Managers' Index plunged to 5.4 in April from 49.3 in March. The score signaled the most severe contraction in output since records began in 2005.

Oil & Gas

• Reliance Industries and Jio Platforms announced that Vista Equity Partners (Vista) will invest Rs 11,367 crore into Jio Platforms. This investment values Jio Platforms at an equity value of Rs 4.91 lakh crore and an enterprise value of Rs 5.16 lakh crore. Vista's investment will translate into a 2.32% equity stake in Jio Platforms on a fully diluted basis, making Vista the largest investor in Jio Platforms behind Reliance Industries and Facebook. Jio Platforms has now raised Rs 60,596.37 crore from leading technology investors in less than three weeks.

Pharmaceuticals

• Biocon has received the Establishment Inspection Report (EIR) from the U.S. Food and Drug Administration (FDA) for the Pre-Approval and GMP inspection of its Small Molecules API Manufacturing Facility at Biocon Park SEZ, Bommansandra, Bengaluru, conducted between 20 January and 24 January 2020. At the conclusion of the inspection the agency had issued a Form 483, with five observations, which are being addressed by the Company. The EIR has been closed with a “VAI” classification forthe observations.

• Dr Reddys Laboratories has received the EstablishmentInspection Report(EIR) from US FDA, for its API manufacturing plant at Srikakulam, Andhra Pradesh (CTO VI) indicating closure ofthe audit and the inspection classification ofthis facility is determined as "VoluntaryAction Indicated"(VAI).

• Zydus Cadila has received final approval from the USFDA to market Deferasirox Tablets for Oral Suspension (US RLD: ExjadeTM Tablets for Oral Suspension) in the strengths of 125 mg, 250 mg and 500 mg.

• Dr. Reddy's Laboratories announced the launch of Desmopressin Acetate Injection USP, 4 mcg/mL Single-dose Ampules, a therapeutic equivalent generic version of DDAVP (desmopressin acetate) Injection , 4 mcg/mL, approved by the U.S. Food and Drug Administration (USFDA).

Automobile

• Maruti Suzuki, Hero MotoCorp, Mercedes Benz India, Eicher Motors, TVS Motor, and Isuzu Motors India announced they had got the clearance from the governments of the states they operate in to resume operations. The companies also announced opening their dealerships in a phased manner.

Metals

• Jindal Stainless Limited has resumed partial operations at its Jajpur facility in Odisha. All the employees will mandatorily follow social distancing and prescribed safety guidelines enforced by the company.

Capital Goods

• Bharat Dynamics has received an order worth Rs 293.33 crore towards supply of MRSAM Missile Sections for Indian Air Force deliverables. The order has to be executed in next 24 months.

INTERNATIONAL NEWS

• US consumer credit fell by $12.1 billion in March after surging up by a downwardly revised $20.0 billion in February. The pullback came as a surprise to economists, who had expected creditto increase by $15.0 billion compared to the $22.3 billion jump originally reported forthe previous month.

• US labor productivity slumped by 2.5 percent in the first quarter after jumping by 1.2 percent in the fourth quarter of 2019. Economists had expected productivity to plunge by 5.5 percent.

• US initial jobless claims dropped to 3.169 million, a decrease of 677,000 from the previous week's revised level of 3.846 million. Economists had expected jobless claims to tumble to 3.000 million from the 3.839 million originally reported for the previous week.

• US factory orders plummeted by 10.3 percent in March after edging down by a revised 0.1 percent in February. Economists had expected factory orders to plunge by 9.8 percent compared to the unchanged reading originally reported for the previous month.

• The average of household spending in Japan was down 6.0 percent on year in March, the Ministry of Internal Affairs and Communications said on Friday - coming in at 292,214 yen. That exceeded expectations for an annual decline of 6.7 percent following the 0.3 percent drop in February.


s

4

EQUITY


5

EQUITY


Beat the street - Fundamental Analysis


IPCA LABORATORIES LIMITED

CMP: 1549.55

Target Price: 1814

Upside: 17%

VALUE PARAMETERS

Face Value (Rs.) 2.00
52 Week High/Low 1821.00/844.20
M.Cap (Rs. in Cr.) 119568.78
EPS (Rs.) 48.98
P/E Ratio (times) 31.62
P/B Ratio (times) 5.76
Dividend Yield (%) 0.19
Stock Exchange BSE

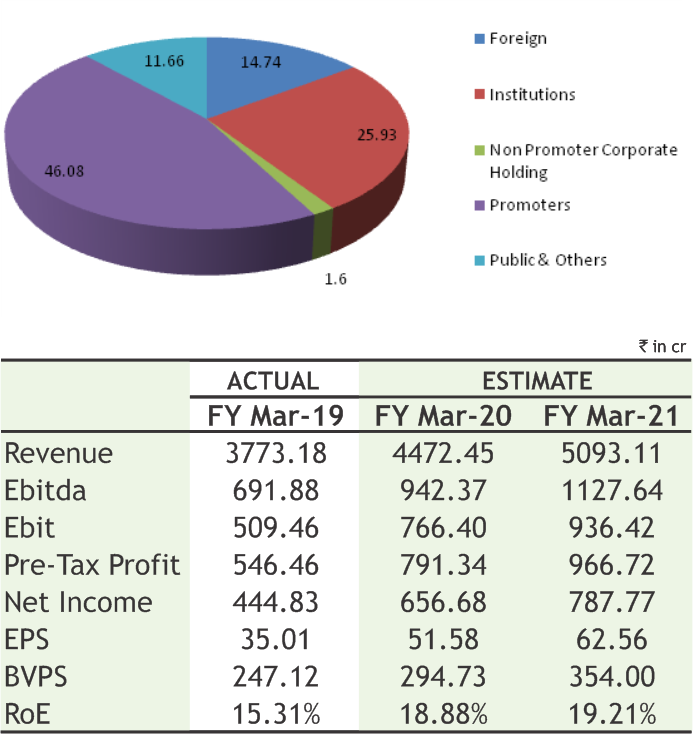
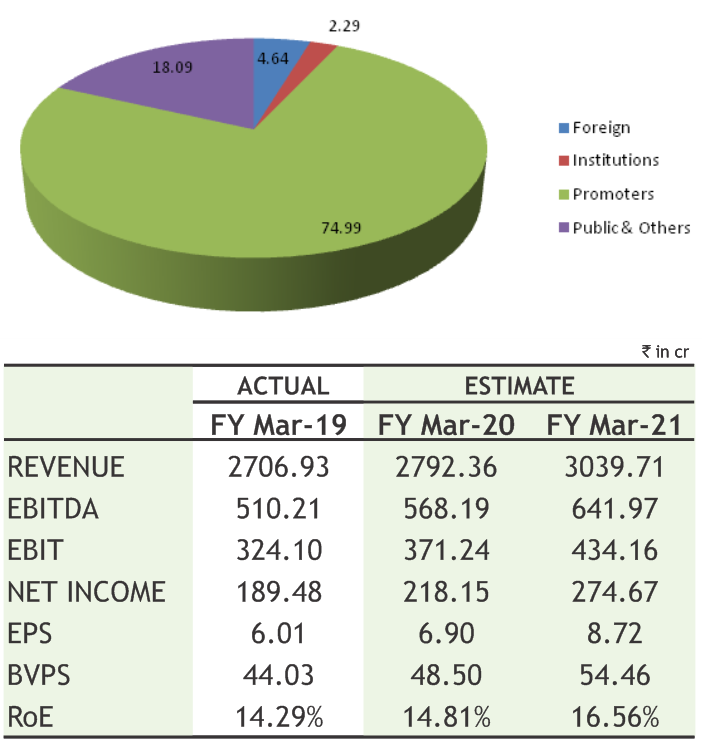
% OF SHARE HOLDING

Investment Rationale

•Ipcalaboratories is a pharmaceutical company with a strong thrust on exports which now account for 48% of Company'sincome.The company is vertically integrated and produces finished dosage forms and active pharmaceutical ingredients.

• The wide infrastructure of the company is well served with large pool of Intellectual Property knowhow supported by large team of in-house scientists. The R&D expenditure of the company during FY19 was Rs.89.35 crore (2.50% of total turnover) as against Rs.118.10 crore in FY18 (3.73% of the turnover in FY18).

• The company has acquired 35 Acres land at Dewas and is in the process to get environment clearance, which would take 6-8 months. Considering the time needed to install equipment and build infrastructure.

• During Q3FY20, IPCAacquired Noble Explochem. The plant has been not operational since 2006 and it will take further 15-18 months to commercialize. IPCA plans to utilize the plant to produce KSM and reduce its dependence on Chinese import. Nobel assets consist of free-hold land of 690 acres, leasehold land of 180 acres and forest land of 239 acres. It also provides access to nitration chemistry to be used for developing/commercializing APIs. Ipca Laboratories wants to spend about Rs.400 crore as capital expenditure on these plants

• The company has 17 manufacturing plants across India which have accreditations from agencies such as UK’s Medicine and Healthcare Products Regulatory Agency (MHRA), World Health Organization (WHO), European Directorate for the Quality of Medicines (EDQM), India’s Central Drugs Standard Control Organization along with several country wise regulatory approvals.

• It has reported a 24.15 per cent rise in consolidated

net profit at Rs 197.54 crore for the quarter ended on December 31, 2019, on account of robust sales. The company had posted a net profit of Rs 159.11 crore for the corresponding period of previous fiscal. Total income also rose to Rs 1,230.99 crore for the quarter under consideration as against Rs 1,019.48 crore in the year-ago period.

Risk

• Faces competition and pricing pressure in the global generics market

• Foreign exchange fluctuation

Valuation

The company is on a strong footing and is well placed to capitalize on the growth opportunities across the domestic and exports markets. Performance across the Formulation and API segment is expected to improve as most headwinds that impacted the performance are behind.Thus, it is expected that the stock will see a price target of Rs.1814 in 8 to 10 months time frame on average P/E of 29x and FY21 (E) earnings of Rs.62.56.

ESSEL PROPACK LIMITED

CMP: 175.35

Target Price: 200

Upside: 14%

VALUE PARAMETERS

Face Value (Rs.) 2.00
52 Week High/Low 203.60/78.85
M.Cap (Rs. in Cr.) 5531.43
EPS (Rs.) 6.97
P/E Ratio (times) 25.16
P/B Ratio (times) 3.91
Dividend Yield (%) 0.71
Stock Exchange BSE

% OF SHARE HOLDING

Investment Rationale

• Essel Propack Ltd is the largest global specialty packaging company, manufacturing laminated plastic tubes catering to the FMCGand Pharma space.

• The development front, recently it has introduced tubes for sanitisers as a suitable solution to ensure adequate essential supplies and to cater diversified needs, the company has come up with different packs (based on different formulations) to ensure safety and usability of the product till end. The increasing proportion of higher-value personal care tubes (currently having 7-8 per cent of market share) would help increase margins for the company.

• The company is also well positioned to benefit from the increasing use of laminated tubes over aluminum. Also, new product launches such as Platina and Green Maple Leaf are expected to contribute to its growth.

• According to the management of the company, strong business development products are in pipeline, would support to give good growth in terms of sales and margin front.

• During the December quarter, the company has improved its cash generation and used that proceed to reduced its debts. it has reduced debts to Rs.361 crore from Rs.614.90 crore.

• The company is the world’s largest laminated tube manufacturer with units operating across countries such as USA, Mexico, Colombia, Poland, Germany, Egypt, Russia, China, Philippines and India. It is constantly developing new technology to cater to threats against competition.

• During Q3FY20, the company operating margins increased 230 bps to 22.2%leading to 20%increase in operating profits toRs157.87crore.

Risk

• Technologicalchanges

• Commodity prices

Valuation

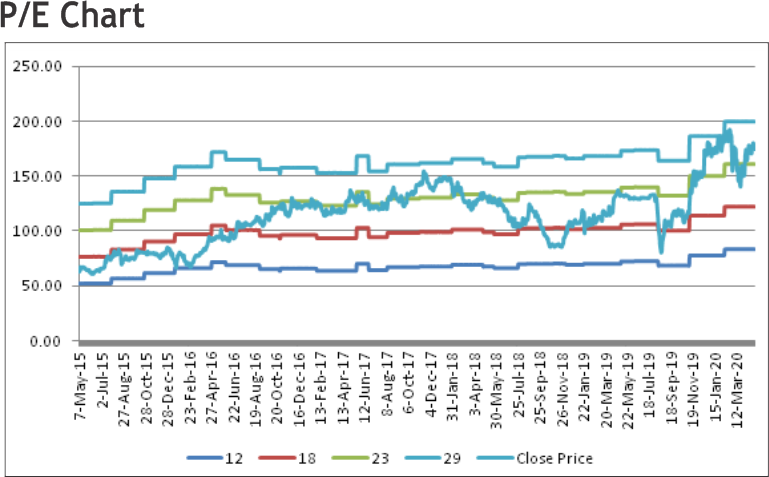
The company has maintained its growth trajectory and has charted out a strategic roadmap that besides helping sustain and boost growth, is also conducive to adapt to the changing needs of customers and business dynamics. Moreover, post Blackstone as the news controlling shareholder, the company is on mission to deliver capital efficient, consistent earnings growth. Forthis,it has revamped the board with fit-for-purpose professionals, strengthened the management team, and engaged Blackstone's global advisor network. The company has identified key levers to execute its mission - accelerated growth in Personal Care, Continued leadership in Oral Care, Innovation and sustainability solutions and prudent capital allocation across regions. Thus, it is expected that the stock will see a price target of Rs.200 in 8 to 10 months time frame on an expected P/E of 23 and FY20 EPS of Rs.8.7.s

Source: Company Website Reuters Capitaline

Above calls are recommended with a time horizon of 8 to 10 months.


6

EQUITY


Beat the Street-Technical Analysis

Indiamart Intermesh Limited (INDIAMART)

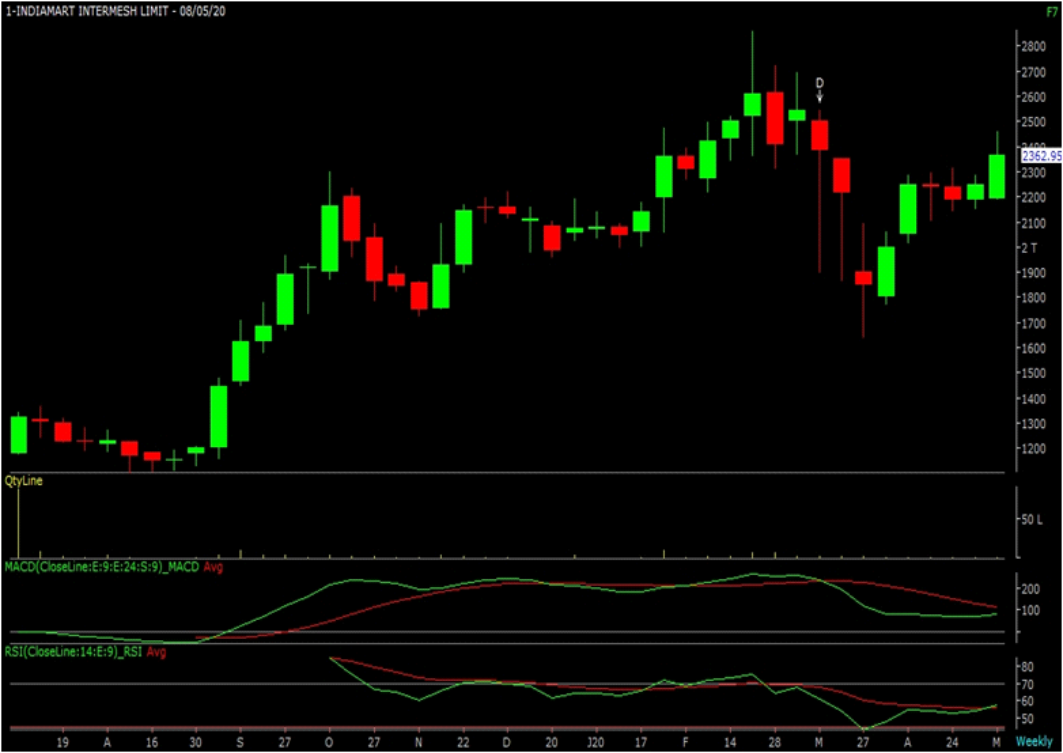
The stock closed at Rs 2362.95 on 08th May 2020. It made a 52-week low at Rs 1102.95 on 08th August 2019 and a 52-week high of Rs. 2862.50 on 20th February, 2020. The 200 days Exponential Moving Average (DEMA) of the stock on the daily chart is currently at Rs 1999.11

Short term, medium term and long term bias are positive for the stock as it is trading in uptrend from last six months. Apart from this, it has formed a “Bull Flag” pattern on daily charts and has given the breakout of pattern and currently trading above the same. So, follow up buying may continue for coming days. Therefore, one can buy in the range of 2340-2350 levels for the upside target of 2570-2600 levels with SL below 2200.

 
SBI Life Insurance Company Limited (SBILIFE)

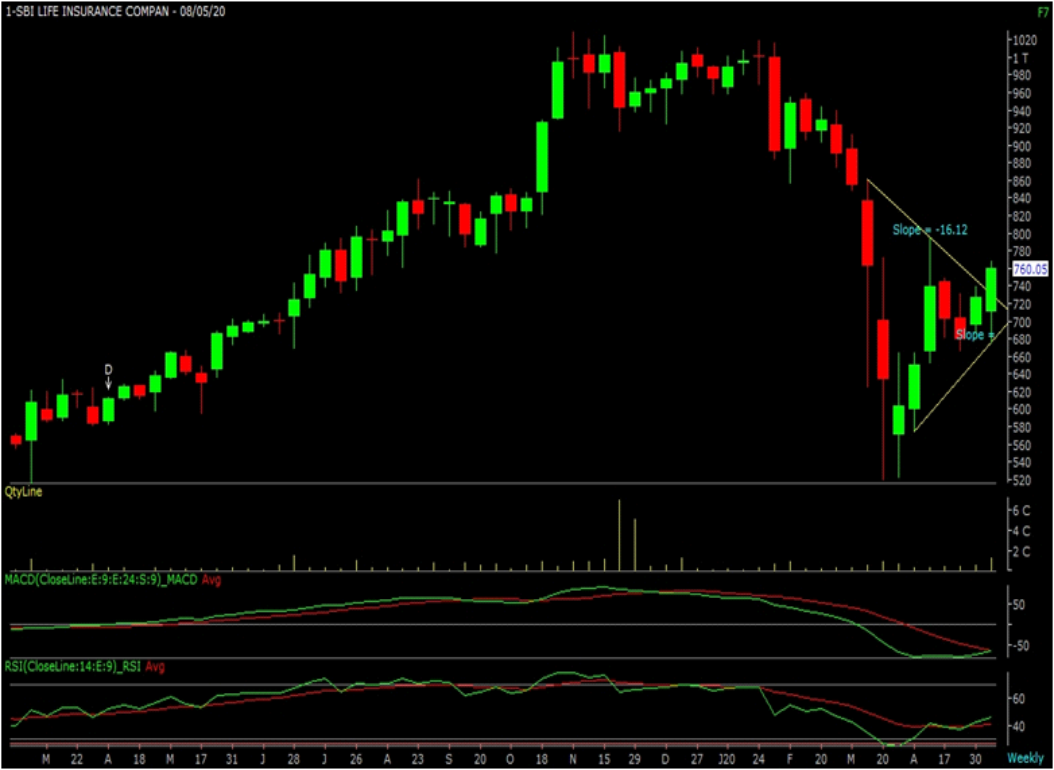
The stock closed at Rs 760.05 on 08th May 2020. It made a 52-week low of Rs 519.40 on 19th March 2019 and a 52-week high of Rs. 1030 on 30th October, 2019. The 200 days Exponential Moving Average (DEMA) of the stock on the daily chart is currently at Rs 810.84

As we can see on charts that stock witnessed massive recovery from yearly low and consolidated in wide range, formed triangle pattern on charts, which is bullish in nature. Last week, stock has given the pattern breakout by registered gains over 4% and also has managed to close above the same along with volumes so buying momentum may continue for coming days. Therefore, one can buy in the range of 745-755 levels for the upside target of 820-840 levels with SL below 700.


Disclaimer : The analyst and its affiliates companies make no representation or warranty in relation to the accuracy, completeness or reliability of the information contained in its research. The analysis contained in the analyst research is based on numerous assumptions. Different assumptions could result in materially different results.

The analyst not any of its affiliated companies not any of their, members, directors, employees or agents accepts any liability for any loss or damage arising out of the use of all or any part of the analysis research.

SOURCE: CAPITAL LINE

Charts by Spider Software India Ltd

Above calls are recommended with a time horizon of 1-2 months

7

DERIVATIVES


WEEKLY VIEW OF THE MARKET


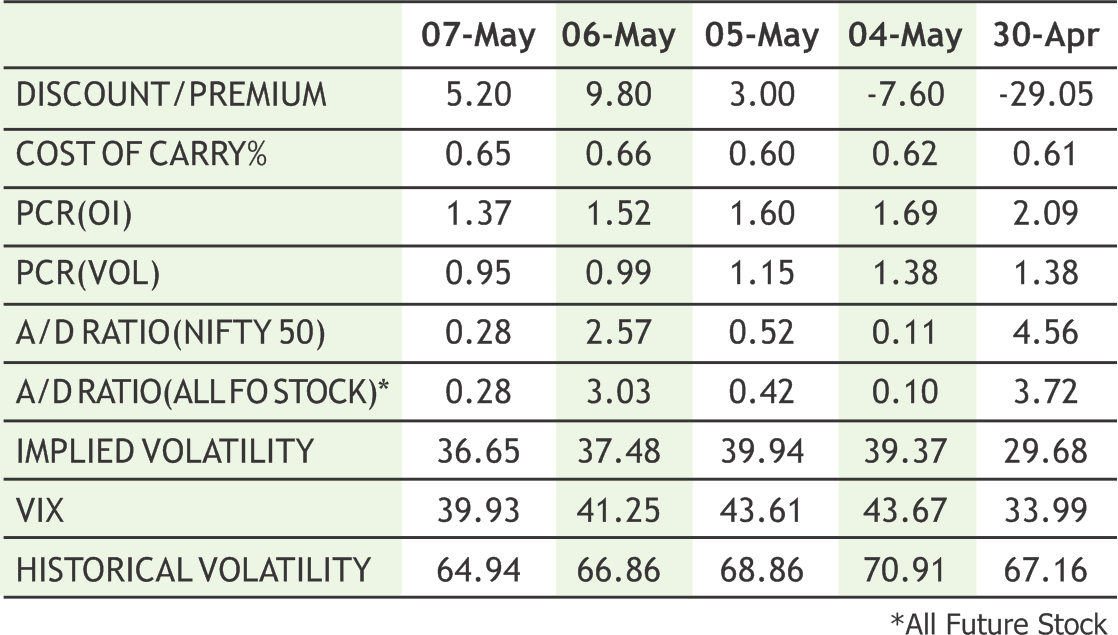
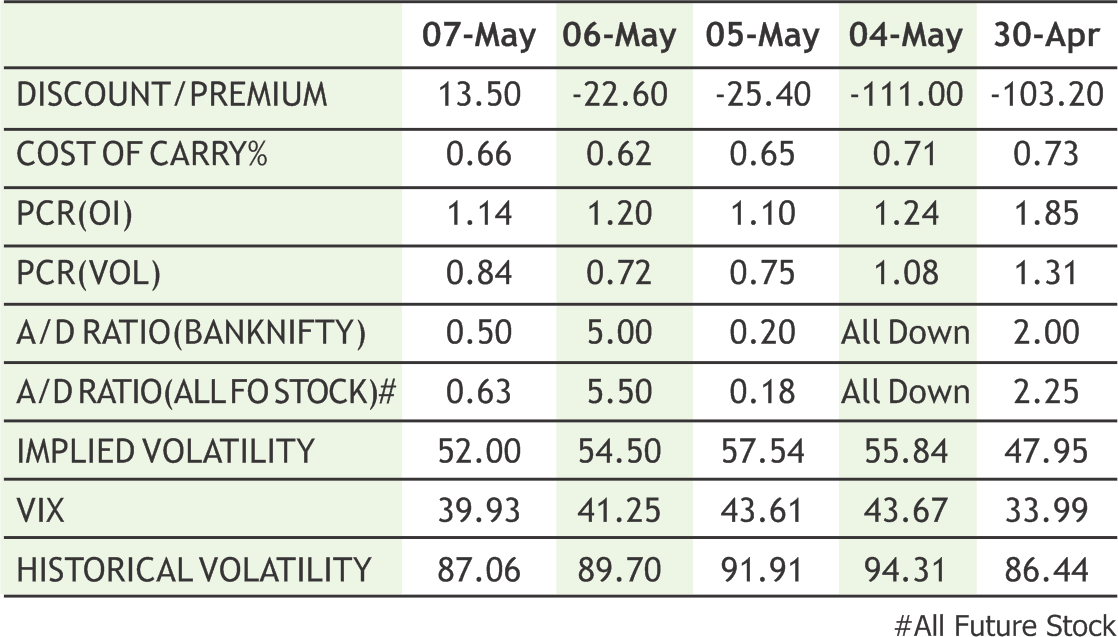
After settling with strong gains in the April series, the Indian market began the May series on a negative note with bears once again taking control over the markets. Subdued global cues along with weak earnings of big domestic companies and India's record low April manufacturing PMI data aggravated the worries of investors. On the derivatives front, we are witnessing a continuous addition of open interest at 9,400 and 9,500 call strikes that point towards a limited upside in the prices. However on the downside, marginal put writing was observed at 9,000 strikes which should act as strong support for Nifty. On the technical front, secondary oscillators and price action is suggesting some consolidation in a broader range of 9,000-9,500 in the coming sessions. The Implied Volatility (IV) of calls closed at 34.23% while that for put options closed at 36.65%. The Nifty VIX for the week closed at 39.93% and is expected to remain volatile. PCR OI for the week closed at 1.37 down as compared to last week at 2.09 which indicates call writing. At the current juncture, traders should remain focussed on stock-specific moves and are advised to trade cautiously tracking global markets as volatility is likely to grip the domestic markets in the coming few sessions.


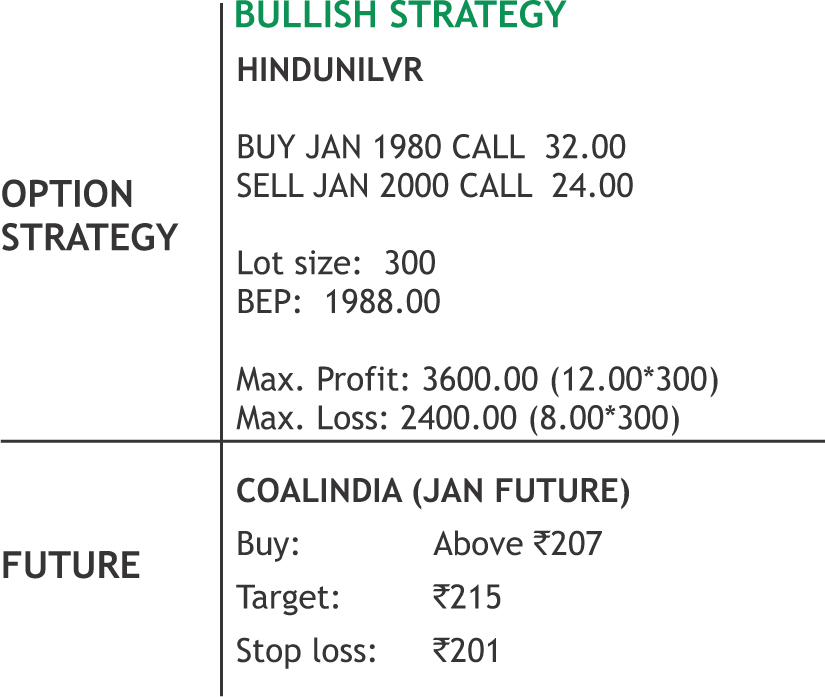
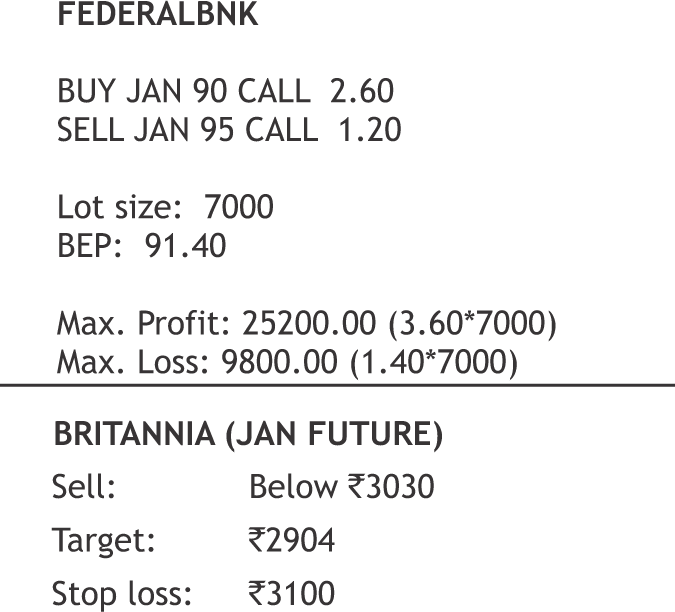
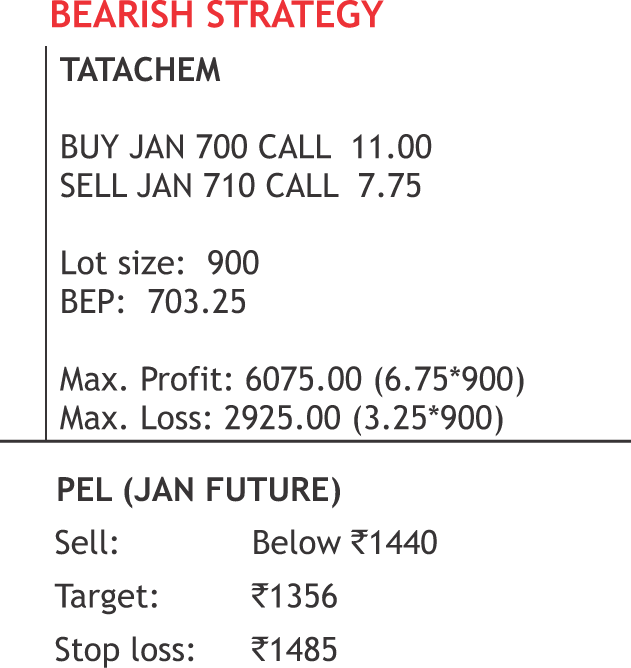
DERIVATIVE STRATEGIES


NIFTY OPTION OI CONCENTRATION (IN QTY) (MONTHLY)


CHANGE IN NIFTY OPTION OI (IN QTY) (MONTHLY)


BANKNIFTY OPTION OI CONCENTRATION (IN QTY) (MONTHLY)


CHANGE IN BANKNIFTY OPTION OI (IN QTY) (MONTHLY)


8

DERIVATIVES


SENTIMENT INDICATOR (NIFTY)


SENTIMENT INDICATOR (BANKNIFTY)


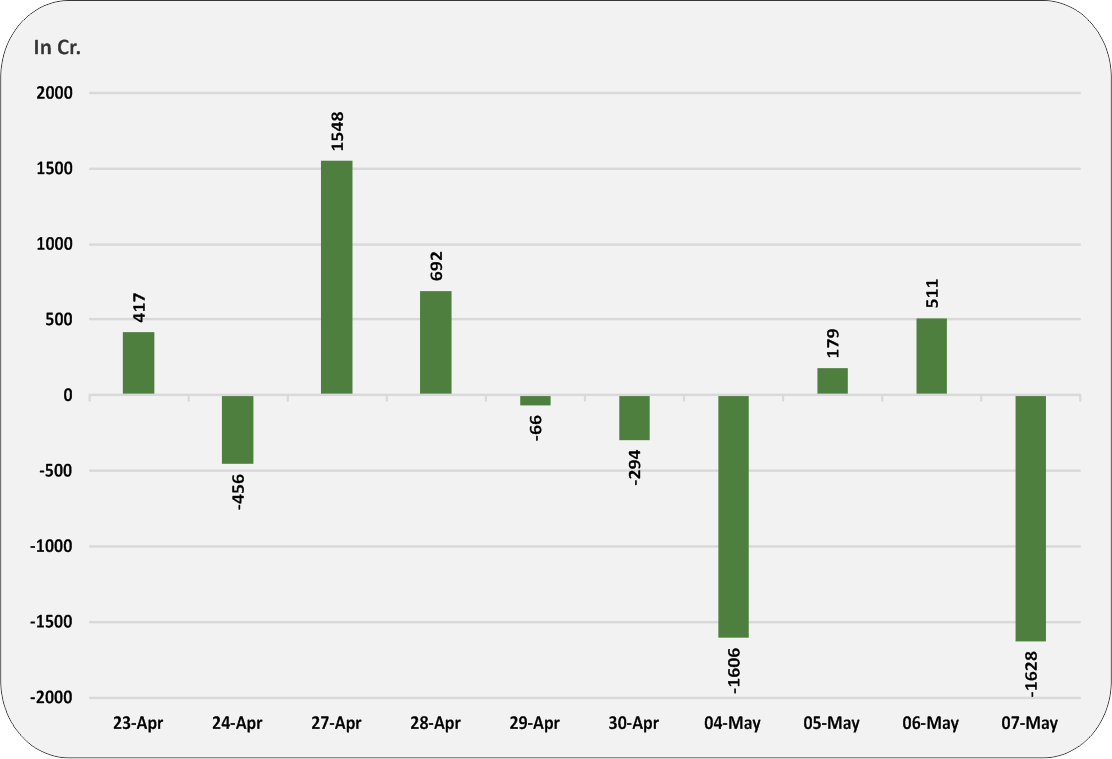
FII’S ACTIVITY IN INDEX FUTURE


FII’s ACTIVITY IN DERIVATIVE SEGMENT


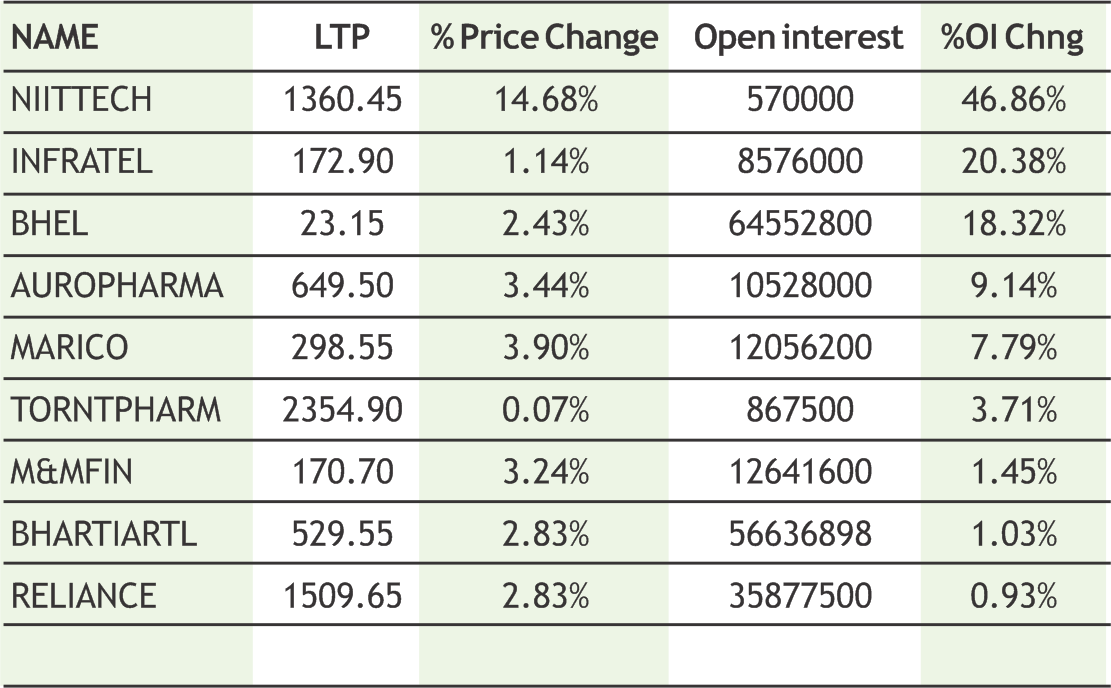
Top 10 Rollover


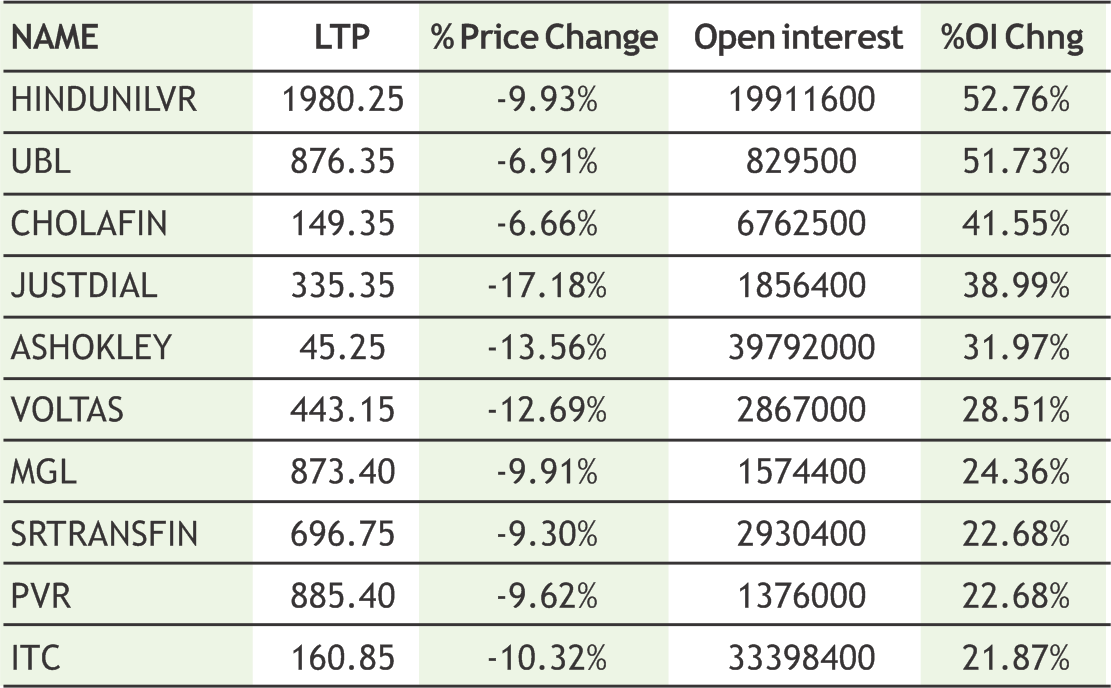
Bottom 10 Rollover


**The highest call open interest acts as resistance and highest put open interest acts as support.

# Price rise with rise in open interest suggests long buildup | Price fall with rise in open interest suggests short buildup

# Price fall with fall in open interest suggests long unwinding | Price rise with fall in open interest suggests short covering


9

COMMODTY


SPICES


Turmeric futures is trading near its 3 year low of 5280 and this bearish trend is likely to persist owing to decline in demand from exporters and bulk buyers such as spice manufacturers amid the ongoing lockdown. Usually demand for turmeric from spice manufactures start coming in from April, but due to the lockdown demand has taken a hit. In days to come, the June contract may test 5000-4800 levels. Cardamom futures (June) may witness recovery till 1800- 1900 levels. It is reported that the Spices Board is looking at the option of online auction of cardamom to help mitigate the impact of Covid-19 crisis. The option of sale of cardamom through e-NAM platform under Union Ministry of Agriculture, is also being explored and the Board has is in the process of consulting with stakeholders. The Spices Board is also continuing with the operation of its laboratories in the country to facilitate exports. Starting from May 5, the cardamom to be exported to Saudi Arabia will be tested at Spices Board’s quality evaluation labs. The short covering in jeera futures (June) may get limited till 13700-13800 as the fundamentals are not much supportive in the present scenario. Spot prices are down amid lower offtake, reduced processing. The off-take is limited with major wholesale consuming sectors such as restaurants and hotels remaining closed. They consume about 7-8 per cent of the overall cumin sales. In addition to that, export orders are not moving due to short-staffed processors. Dhaniya futures (June) may consolidate sideways in the range of 5630-5930 levels. The masala companies are buying only on a limited scale and often they are approaching farmers directly. Demand for coriander is steady.

BULLIONS


Bullion counter may continue its upside momentum as risk sentiment was weakened by rising U.S.-China tensions over the coronavirus coupled with string of weak economic data, including surging unemployment in the United States, heightened fears over a coronovirus-induced global downturn. The outbreak has infected more than 3.71 million people globally, battered global growth and prompted investors to seek safe havens such as gold. Meanwhile on investors' radar are developments surrounding U.S.-China trade as President Donald Trump's administration is weighing punitive actions against Beijing over its early handling of the outbreak. Gold can move towards 46800 while taking support near 45500 while silver may move higher towards 44500 while taking support near 42000. India’s gold imports plunged 99.9% year-on-year in April to their lowest in nearly three decades as air travel was banned and jewellery shops were closed amid a nationwide lockdown to curb the spread of coronavirus. Big central banks are buying from an expanding menu of government bonds, corporate debt and consumer loans to help businesses and households through the pandemic. Australia's Perth Mint stated that its gold sales shot up in April to their highest level in at least eight years as concerns of a shortage prompted investors to stock up to seek cover from the economic blow from the coronavirus. Trump stated that he would be able to report in about a week or two whether China is fulfilling its obligations under a Phase 1 trade deal, even as his administration is weighing actions against Beijing over its handling of the virus.


OIL AND OILSEEDS


The upside momentum in soybean futures (June) doesn’t look sustainable and it may face resistance near 3870 levels. India's soymeal exports may fall due to subdued demand from traditional overseas buyers amid ongoing lockdowns. Shutdowns in several parts of the world have hit supply chains, with transport restrictions preventing soymeal from getting delivered to poultry farms and even demand for the livestock also fell on the scare of coronavirus. Also, there is a negative news coming from the international market that Chinese buyers are now mostly focused on booking July and August shipments of cheaper Brazilian beans due to competitive prices as compared to US origin. Last week, US-China trade relationship seems to have hit turbulence recently due to cross-allegations on the coronavirus pandemic mismanagement due to which the Phase 1 trade deal could be under pressure. Mustard futures (June) is looking bullish for 4250-4350 levels, hence a dip towards 4110 levels can be considered as buying opportunity. In this peak crushing season, the availability of mustard seeds with the mills has eased a lot as arthiyas are supplying mustard seeds. Labour problem has also more or less eased. Trucks loaded with edible oils are now reaching interior areas to reach out to the dealers and distributors. In days to come, soy oil futures (June) may continue to trade with a downside bias & remain below 765, while CPO futures (May) trade with a downside bias in the range of 580-610 levels. There is demand destruction across all major consuming sectors and the monthly demand for edible oils in the country has fallen by 30%. In the international market, the outlook is bearish for vegetable oil prices and palm prices due to potential cutback in biofuel demand.

ENERGY COMPLEX


Crude oil may witness upside movement as the output cuts combined with the loosening of business restrictions in some U.S. states and cities around the world were expected to ease the global fuel glut and pressure on storage tanks, helping to drive prices up. Prospects improved for fuel demand as some U.S. states and several countries, including Italy, Spain, Portugal, India and Thailand, began allowing some people to go back to work and opened up construction sites, parks and libraries. Meanwhile the top two U.S. producers, Exxon Mobil Corp and Chevron Corp, each said they would cut output by 400,000 barrels per day this quarter. Crude oil can recover 2100 by taking support near 1500. Saudi Arabia’s crude oil exports in May are expected to drop to about 6 million barrels per day (bpd), the lowest in almost a decade, and domestic refining output is likely to fall as the coronavirus crisis hits demand. Meanwhile Iraq, OPEC’s second-largest producer after Saudi Arabia, has not yet informed customers of impending restrictions on its oil exports, suggesting it is struggling to fully comply with a deal between the OPEC and other producers like Russia to cut output by a record amount. Natural gas can remain on sideways path as it can face resistance near165 while taking support near 130 levels. The weather is expected to be much warmer than normal on the west coast and much cooler than normal on the east coast according to the most recent report from the National Oceanic Atmospheric Administration.


OTHER COMMODITIES


Cotton futures (May) may see a pull back towards 16000-16650 levels. The reasons being firstly, the Indian cotton is now cheaper than anywhere else in the world, trading at a 12-15 percent discount to prices globally. Hence, we may attract export orders from the countries that are slowly opening the lockdown. Secondly, the market participants have again turned optimistic about demand from China especially after the U.S. government export sales report that included higher sales to China. Chana futures (June) may trade sideways in the range of 4100-4300 levels. Trade related activities are minimum due to the lockdown situation and the difficulty in getting transport vehicles etc. has led to significant drop in the daily arrivals. Arrivals normally peak by May but this time peak arrival month seems to be June. Demand is also suffering due to closure of restaurants, small eatery joints, big retail chains etc. which is adversely affected overall demand. Castor seed futures is trading nearly just to its yearly low of 3608 and going ahead this bearish trend in June contract will possibly get extended to 3500 levels. Manufacturing and trade curbs all over the world in the wake of the coronavirus pandemic hurt India's castor oil exports in the last leg of 2019-20 (Apr-Mar). Overseas shipments of the industry oil are seen at around 500,000 tn in 2019-20 (AprMar), down from 570,000 tn in the previous last year. Manufacturing and sales are hit hugely during the lockdown. Lower-than-expected demand from China, Japan, the US, and Europe will likely keep the export figures depressed in the coming months. Domestic demand for castor oil has declined by 40-45% due to the lockdown as crushing of the oilseed and overall trade has been affected.

BASE METALS


Base metals may remain on upside path on supply concerns. Copper may test 425 levels while taking support near 380 levels. The global copper market is headed for a surplus of between 200,000-300,000 tonnes in 2020. Supply prospects for copper, got a boost after Peru, the world’s second-biggestproducer of copper. Glencore’s Zambian subsidiary Mopani Copper Mines will resume mining for 90 days following a backlash from the government, but the company still expects to go ahead with its initial plan to place operations on hold. Copper supply, meanwhile, has been massively disrupted by national lockdowns of mines, particularly in Peru, a major supplier of raw materials to China’s smelters. Freeport-McMoRan Inc is planning to reassess operations at a New Mexico copper mine that has been temporarily shuttered due to the COVID-19. China's unwrought copper imports rose 4.4% in April from the prior month. In signs of rising demand, on-warrant LME inventories of copper fell to their lowest in a month, slipping 250 tonnes to 190,200 tonnes. Zinc may recover towards 162 by taking support near 145. Zinc prices hit their highest in nearly five weeks as promises of more stimulus from Beijing boosted steel prices. Lead may face resistance near 140 levels while taking support near 128. Nickel may witness recovery towards 960 while taking support near 900 levels. Aluminum also may remain in narrow range of 129-138 levels. The metal used in packaging and transportation has tumbled around 20% since mid-January as the coronavirus pandemic shuttered global industry. But global output has risen, and it is expected a surplus of 1.5 million tonnes this year in the roughly 60-million tonne a year market.

10

COMMODTY


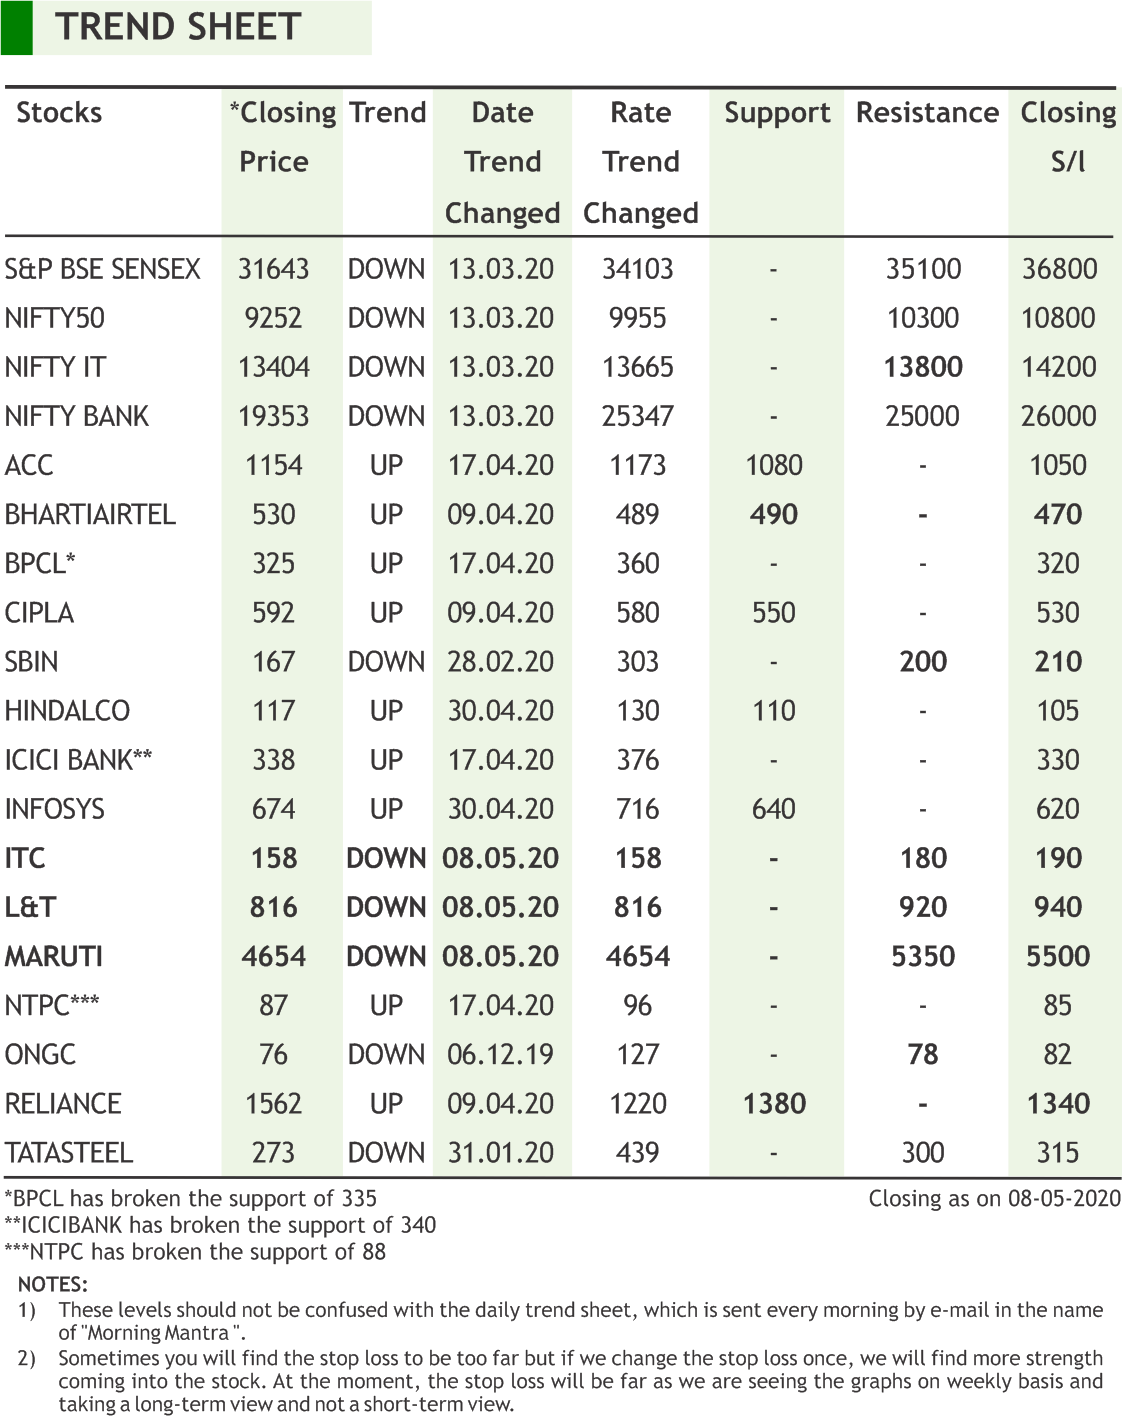
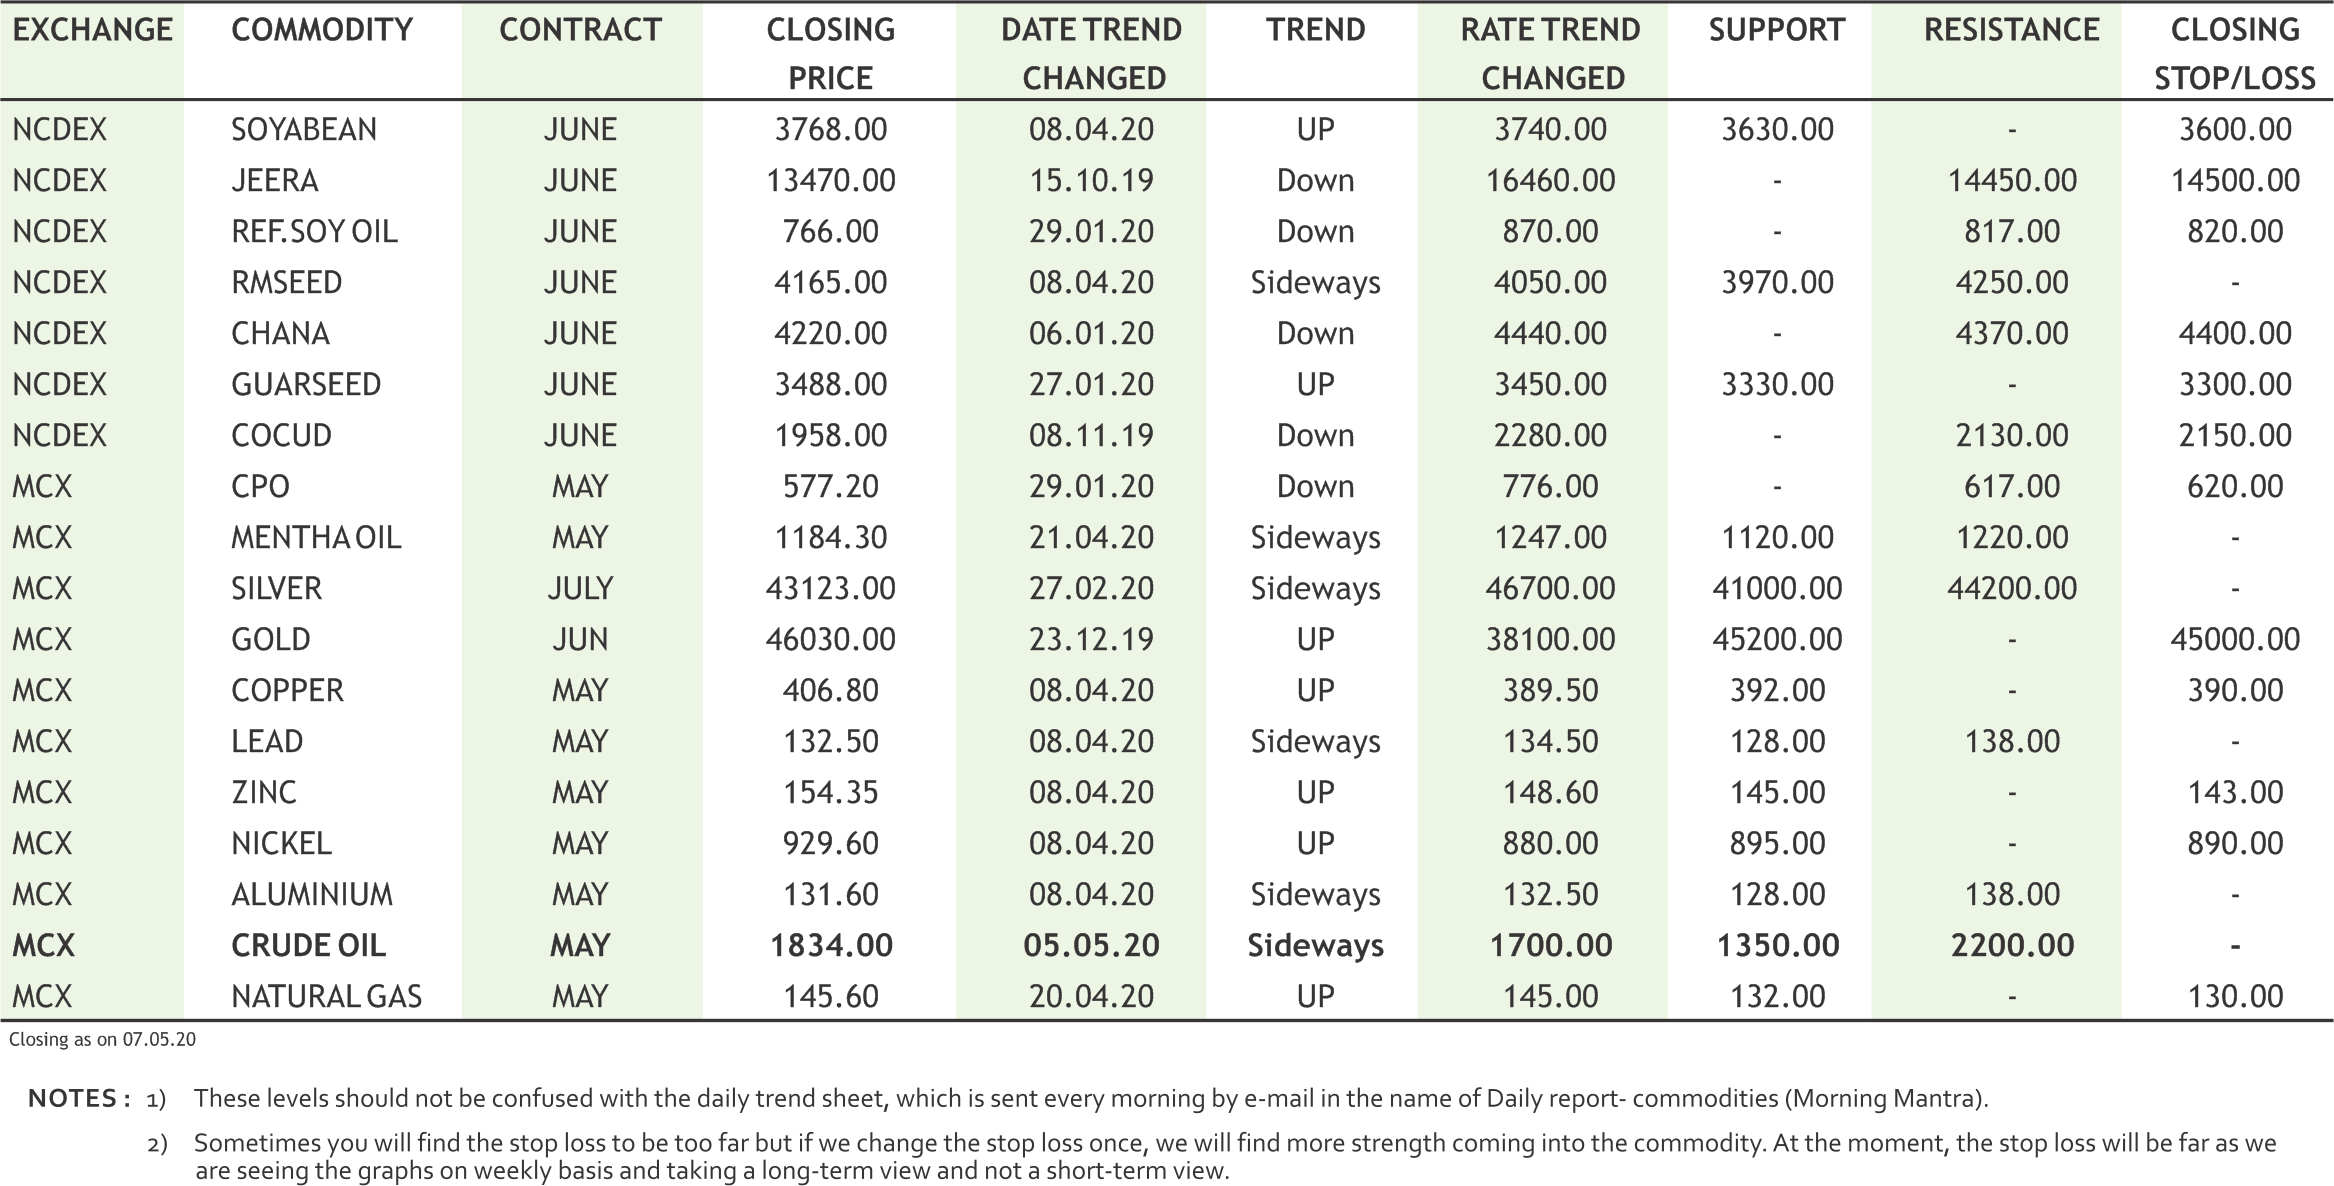
TREND SHEET


TECHNICAL RECOMMENDATIONS


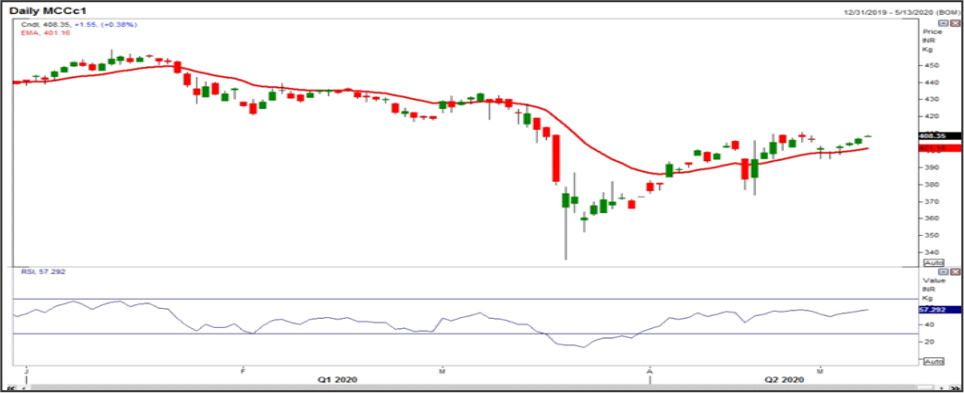
COPPER MCX (MAY) contract closed at Rs. 406.80 on 07th May’2020. The contract made its high of Rs. 436.00 on 06th Mar’2020 and a low of Rs.362.20 on 23rd Mar’2020. The 18- day Exponential Moving Average of the commodity is currently at Rs.401.16 On the daily chart, the commodity has Relative Strength Index (14-day) value of 57.29.

One can buy around Rs. 402 for a target of Rs.425 with the stop loss of Rs.392


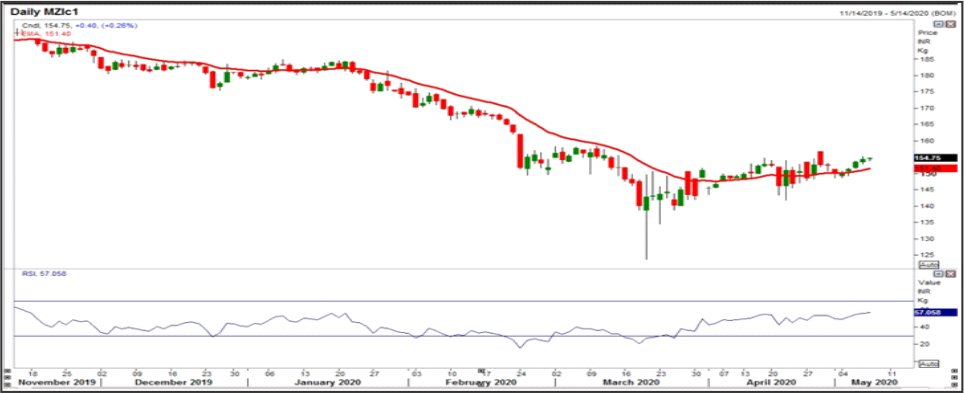
ZINC MCX (MAY) contract closed at Rs. 154.35 on 07th May’2020. The contract made its high of Rs. 189.90 on 09th Jan’2020 and a low of Rs. 131.95 on 19th Mar’2020. The 18-day Exponential Moving Average of the commodity is currently at Rs. 151.40 on the daily chart, the commodity has Relative Strength Index (14-day) value of 57.05.

One can buy around Rs.150 for a target of Rs. 165 with the stop loss of Rs. 145.

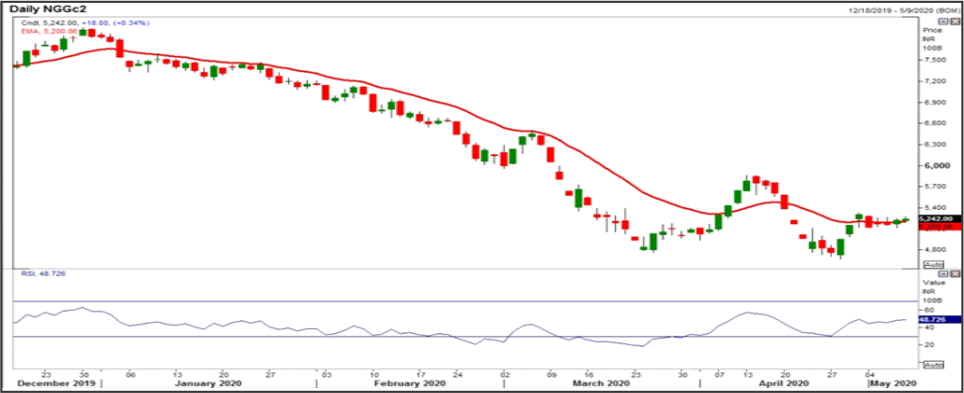
GUARGUM NCDEX (JUNE) contract was closed at Rs. 5224 on 07th May’2020. The contract made its high of Rs. 5835 on 16th Apr’2020 and a low of Rs. 4717 on 28th Apr’2020. The 18-day Exponential Moving Average of the commodity is currently at Rs. 5200.86onthedailychart,thecommodityhasRelativeStrengthIndex(14-day)valueof48.72.

One can buy at Rs. 5170 for a target of Rs.5470 with the stop loss of Rs 5050.


11

COMMODTY


NEWS DIGEST


Ÿ ICAC has projected that cotton offtake is set to shrink by 11.8 per cent as bleak economic conditions triggered by Covid-19 containment measures across the globe.

Ÿ NAFED procures 319800.74 MT mustard seed in Rabi2020 season till 4th May, 2020 at minimum support price of Rs. 4425 per quintal.

Ÿ China’s imports of unwrought copper rose to 460,952 tonnes in April, a gain of 4.3% on March and up 13.8% from April last year

Ÿ India’s gold imports plunged 99.9 per cent year-on-year in April to their lowest in nearly three decades.

Ÿ Glencore’s Zambian subsidiary Mopani Copper Mines will resume mining for 90 days following a backlash from the government, but the company still expects to go ahead with its initial plan to place operations on hold.

Ÿ Europe’s biggest copper smelter Aurubis won European Union antitrust approval for its planned 380 million euro ($414.66 million) acquisition of Belgian-Spanish metal recycling group Metallo, the European Commission stated.

Ÿ Activity in China's manufacturing sector, a key source of copper demand, expanded for a second straight month in April as more businesses resumed work from coronavirus-led shutdowns.

Ÿ The BoE said Britain could be headed for its biggest economic slump in over 300 years due to the coronavirus lockdown and kept the door open for more stimulus next month.

WEEKLY COMMENTARY


Some recovery witnessed in commodities in past few weeks. Market players are cautiously optimistic with lockdown measures continue to be loosened in major economies, leading to slow but steady increases in demand in the world. Crude prices saw good jump in the prices and WTI slowly crawled towards $25 after many weeks. On MCX, it made a low of 795 two weeks back and last week it crossed the crucial level of 2000 and hit the high of 2043. Though on Thursday we noticed some profit booking from higher side. Nascent signs of rebounding gasoline demand in the U.S. and a rapid curtailment of oil production that has seen U.S. producers cut over 1 million barrels per day of output in a matter of weeks has enabled oil prices to recover. Natural gas too became pricy in the week gone by and made a high of 163.8. Industrial metals too saw some gain further on ease of lockdown issue though the upside was capped as import data from China was weak, nevertheless export data was better than expected. Copper imports are up 10.4% in China, also boosted by a drawdown of stockpiles in warehouses overseen by the Shanghai Futures Exchange and arbitrage opportunities for traders between LME and SHFE prices. Nickel prices jumped after mining company Vale slashed its annual output target for the stainless steel ingredient due to the impact of the coronavirus pandemic. In bullion counter, buying returned in gold though it was more prominent in silver which rose sharply. Tumbling economic data and the jobs situation in the United States, where millions continue to file first-time unemployment claims each week, are prompting hedgers to look again at gold.

In agri commodities, oilseeds moved higher on offtake whereas edible traded down on ample of supply and were in backwardation. U.S soybean futures prices rebounded on renewed Chinese buying of corn and soy and as forecasts for sub-freezing temperatures across the country stoked concerns that some vulnerable crops may sustain damage. India's edible oils import declined by 34 per cent to 7,90,377 tonne during April mainly due to logistics related issues during the lockdown. The total shipment of edible oils fell by 14 per cent to 61,82,184 tonne during November-April period of the 2019-20 oil year from 72,03,830 tonne in the yearago same months.In spices counter, only turmeric saw some decline, rest of the commodities moved higher. The sales of the yellow spice is falling in Erode as the traders are mainly buying turmeric in Erode and not placing any bulk order as the exports have slowed down. Guar rebounded.

NCDEX TOP GAINERS & LOSERS (% Change)


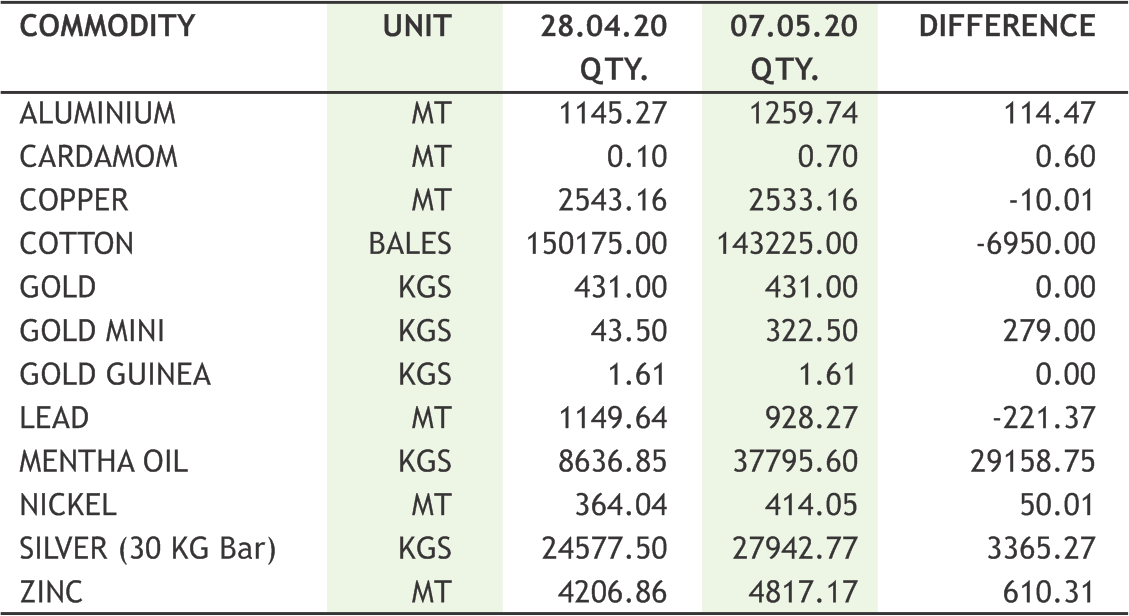
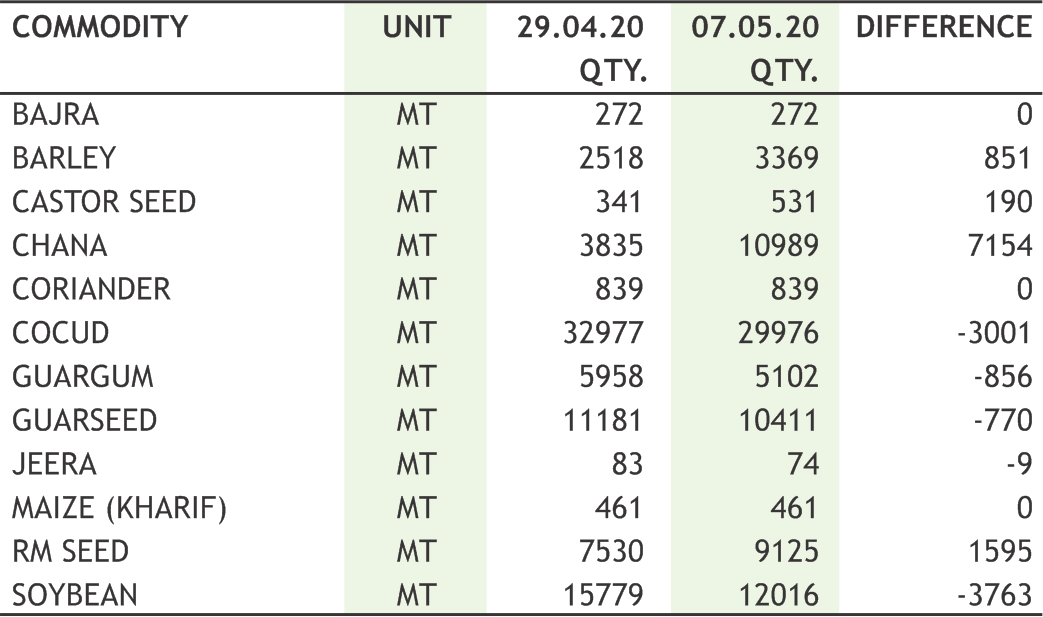
WEEKLY STOCK POSITIONS IN WAREHOUSE (NCDEX)


MCX TOP GAINERS & LOSERS (% Change)


WEEKLY STOCK POSITIONS IN WAREHOUSE (MCX)


12

COMMODTY


SPOT PRICES (% change)


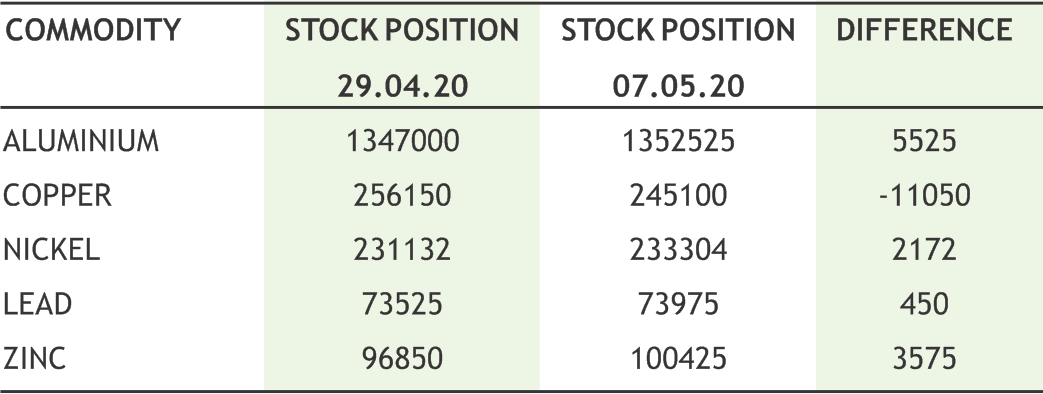
WEEKLY STOCK POSITIONS IN LME (IN TONNES)


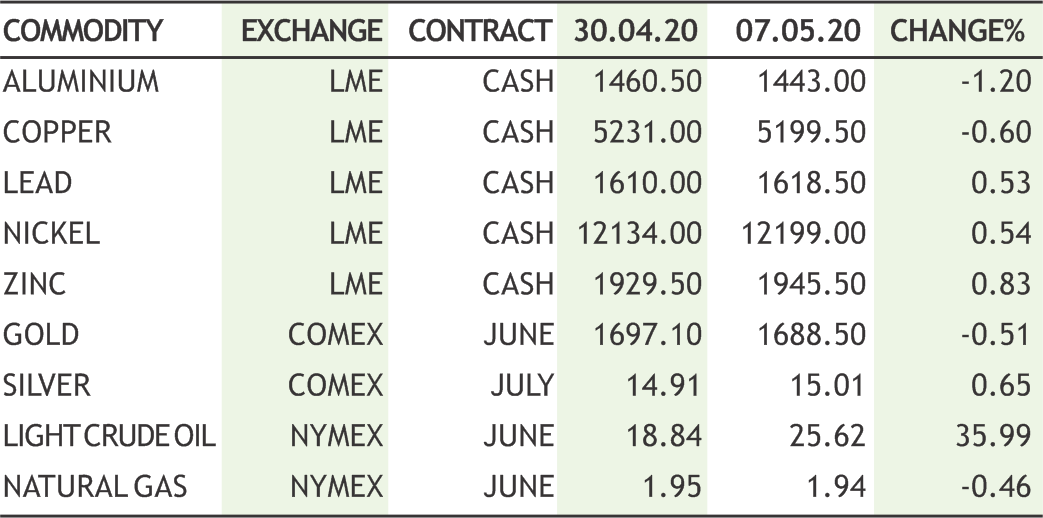
PRICES OF COMMODITIES IN LME/ COMEX/ NYMEX (in US $)


India's gold demand on 11-year low in March quarter


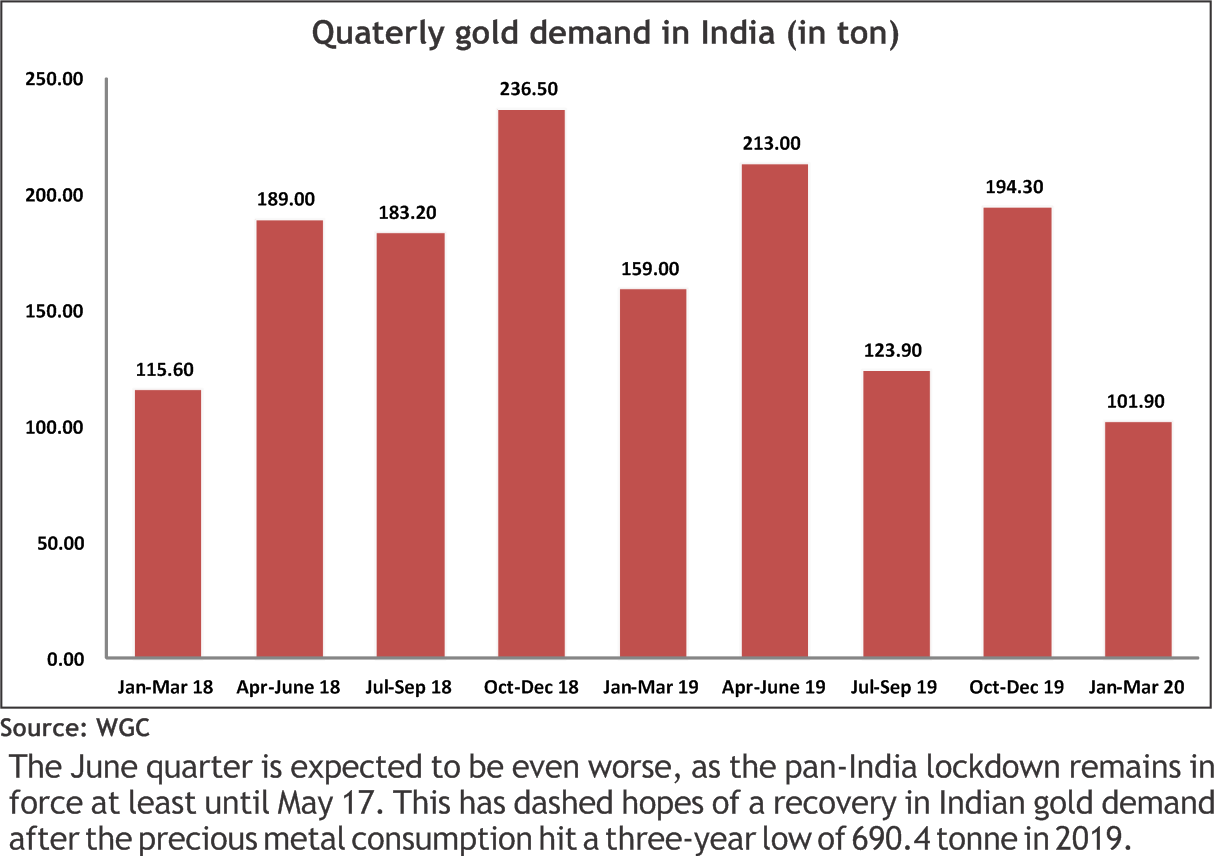
Gold is considered as safe haven at the time of crisis but currently demand of this yellow metal subdued when world feared in worse crisis of decades. According to the World Gold Council's Q1 Gold Demand Trends report, gold demand in India fell 36 percent in the January-March quarter of this year to 101.9 tonne compared to 159 tonnes in the corresponding period last year due to volatile prices, economic uncertainties and coronavirus-induced nationwide lockdown towards the end of the quarter that has forced the closure of wholesale and retail showrooms. Immediate after the Lehman crisis, India’s gold demand was reported at a mere 40.9 tonnes during January-March 2009.

In terms of value, India's the first quarter gold demand fell 20 percent to Rs 37,580 crore, compared to Rs 47,000 crore in the same period of 2019.

The jewellery demand plunged by a sharp 41 per cent to 73.9 tonnes ($3.8 billion) hitting an 11- year QoQ low for the first quarter of calender 2020, from 125.4 tonnes ($5.3 billion) in the same period last year, while investment (bar & coin )demand reported a decline of 17 per cent to 28.1 tonnes ($1.4 billion) as against 33.6 tonnes ($1.4 billion) in the comparable period last year. Investment demand, though lower by 17 per cent, was relatively better as sentiments towards equities turned negative and investors turned to gold’s liquidity and safe haven status

Why gold demand dropped

Indian gold demand in Q1 dropped due to a combination of factors such as high and volatile prices, economic uncertainties and towards end of the quarter, severe logistical freeze following lockdown. India announced a three-week nationwide lockdown on March 25, which was later extended till May 3 and after that till May 17. On an average, the Indian gold prices were up by 26.6% y-o-y in the March quarter to Rs 41,124 per 10 grams. A rise in the gold prices globally, thanks to its safe-haven appeal, and the weakening of the rupee had driven up domestic gold prices to a record Rs 44,315 per ten grams last month. The lifetime high prices has dampened the gold demand in India.

Concerns around economic growth also impacted demand. India’s GDP growth has been on a downward trajectory since Q1 2019. Due to such a backdrop, consumer spending on non-essential items declined. This was accentuated by the outbreak of COVID-19 in March.

Global gold demand marginally up

Despite the havoc created by Covid-19 across the world, with most economies implementing nationwide lockdowns, global gold demand was up a marginal one per cent to 1,083 tonnes in the March 2020 quarter. This was largely on account of a sharp increase in flows into exchange-traded funds (ETFs) backed by physical gold. Total flow into gold ETFs during the quarter increased seven fold to 298 tonnes this year from 43 tonnes last year, driven largely by massive investment in the United States and Europe. Investors in India increased their holding in gold ETFs too.

The June quarter is expected to be even worse, as the pan-India lockdown remains in force at least until May 17. This has dashed hopes of a recovery in Indian gold demand afterthe precious metal consumption hit a three-yearlow of 690.4 tonne in 2019.

INTERNATIONAL COMMODITY PRICES


13

CURRENCY


Currency Table


News Flows of last week


04th MAY Australia job advertisements plunged record 53.1% in April - ANZ
04th MAY Trump said up to 100,000 Americans may die from coronavirus
05th MAY U.S., UK launch trade talks, pledged quick deal as virus ravages global economy
05th MAY U.S. services sector activity falls to new record lows - IHS Markit
06th MAY U.S. Treasury to distribute $4.8 billion in pandemic funds to tribal governments
06th MAY U.S. private payrolls dive by a record 20.2 million
07th MAY China's April exports rebound but outlook remains grim
07th MAY Bank of England sees worst slump in 300 years as corona virus bites

Market Stance


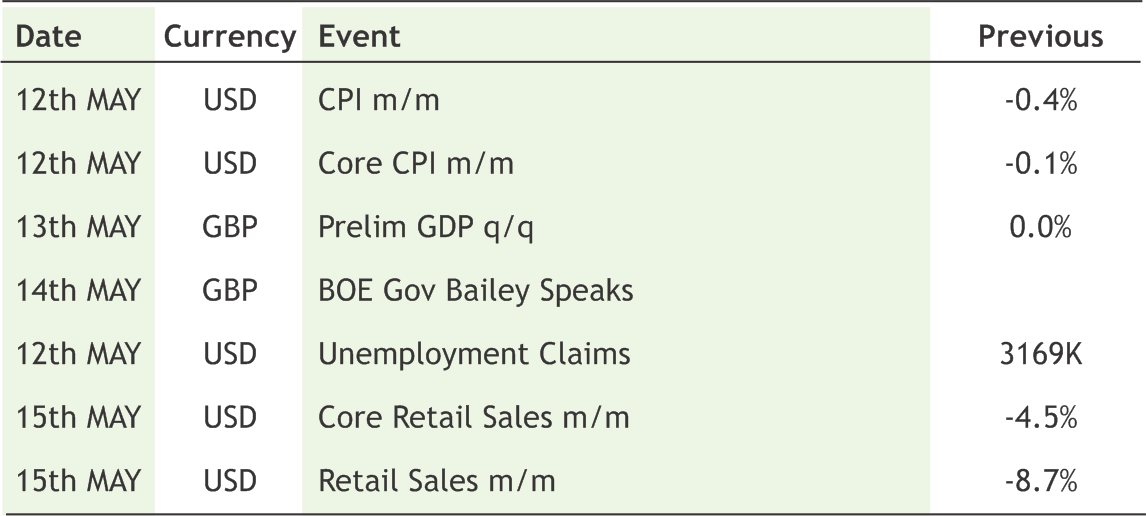
Indian rupee weakened by more than seven-tenth percent this week amid worries over US-China trade war dialogues re-surfacing after several weeks of lock-down which hit the global economy substantially. The latest domestic services PMI recorded as much as low to 5.40 in April compared to 49.30 in March highlights the weakness in the economy due to several weeks of lock-down. However PMI doesn't drive the market as it is a sentiment survey number which may be worthless during lock-down. It seems possible that rupee may hit 77.00 in coming weeks but certain flows in this month may provide some cushion per se few PE funds are expected to acquire Indian chemical unit for roughly more than $600 million and another PE named Silver Lake entered into an agreement with RIL to invest over $700 million in Jio are the prominent deal that may help rupee to get support around 76.30. On the global front, euro dipped below $1.09 after Germany’s court has threatened to block fresh purchases of German bonds through the ECB’s flagship stimulus program. Meanwhile the Turkish Lira crisis resumes once again which rout the emerging currencies in 2018. Recently the lira slid towards an all-time low to $7.23 this week as the country’s finance minister used a rare call with foreign investors to insist that the country would rapidly recover from the economic effects of corona virus. Turning to next week, sentiment in financial markets amid lifting lock-down will guide currencies pairs undermining any major economic releases.

Economic gauge for the next week


Technical Recommendation

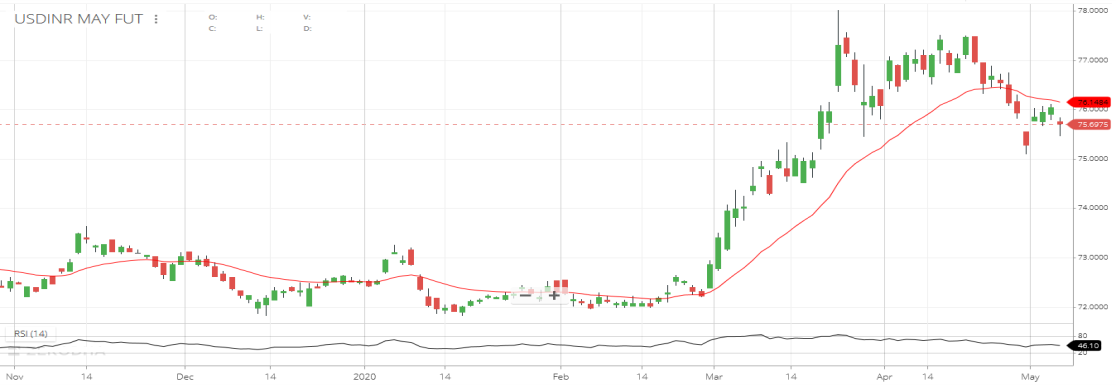
USD/INR (MAY) contract closed at 76.0325 on 06-May-2020. The contract made its high of 76.1000 on 06-May-2020 and a low of 75.7525 on 04-May-2020 (Weekly Basis). The 21-day Exponential MovingAverage oftheUSD/INR is currently at 76.15

On the daily chart, the USD/INR has Relative Strength Index (14-day) value of 46.29. One can buy @ 75.50 for the target of 76.50 with the stop loss of 74.99.


EUR/INR (MAY) contract closed at 82.1625 on 06-May-2020. The contract made its high of 83.0900 on 04-May-2020 and a low of 81.9375 on 06-May-2020 (Weekly Basis).The 21-day Exponential Moving Average of the EUR/INR is currently at 82.01

On the daily chart, EUR/INR has Relative Strength Index (14-day) value of 44.00. One can sell at 82.5 for a target of 81.50 with the stop loss of 83.00.

GBP/INR (MAY) contract closed at 94.7500 on 29-Apr-2020. The contract made its high of 95.1975 on 29-Apr-2020 and a low of 94.0125 on 29-Apr-2020 (Weekly Basis). The 21-day Exponential MovingAverage oftheGBP/INR is currently at 94.40

On the daily chart, GBP/INR has Relative Strength Index (14-day) value of 46.6. One can sell at 94.00 for a target of 92.5 with the stop loss of 94.51.

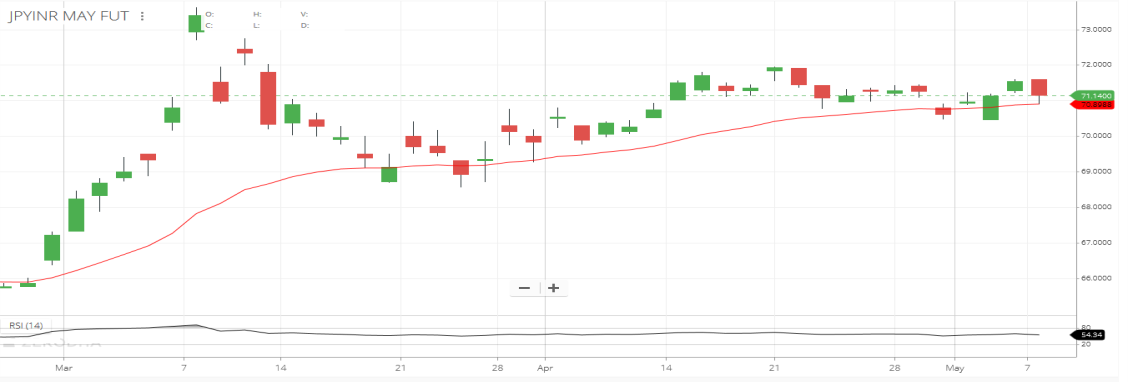
JPY/INR (MAY) contract closed at 71.5425 on 06-May-2020. The contract made its high of 71.5950 on 06-May-2020 and a low of 70.8600 on 04-May-2020 (Weekly Basis). The 21-day Exponential MovingAverage ofthe JPY/INR is currently at 70.89

On the daily chart, JPY/INR has Relative Strength Index (14-day) value of 51.10. One can buy at 70.50-70.40 for a target of 72.00 with the stop loss of 69.90.On the daily chart, JPY/INR has Relative Strength Index (14-day) value of 54.30. One can buy at 71 for a target of 72.00 with the stop loss of 70.49.


14

IPO


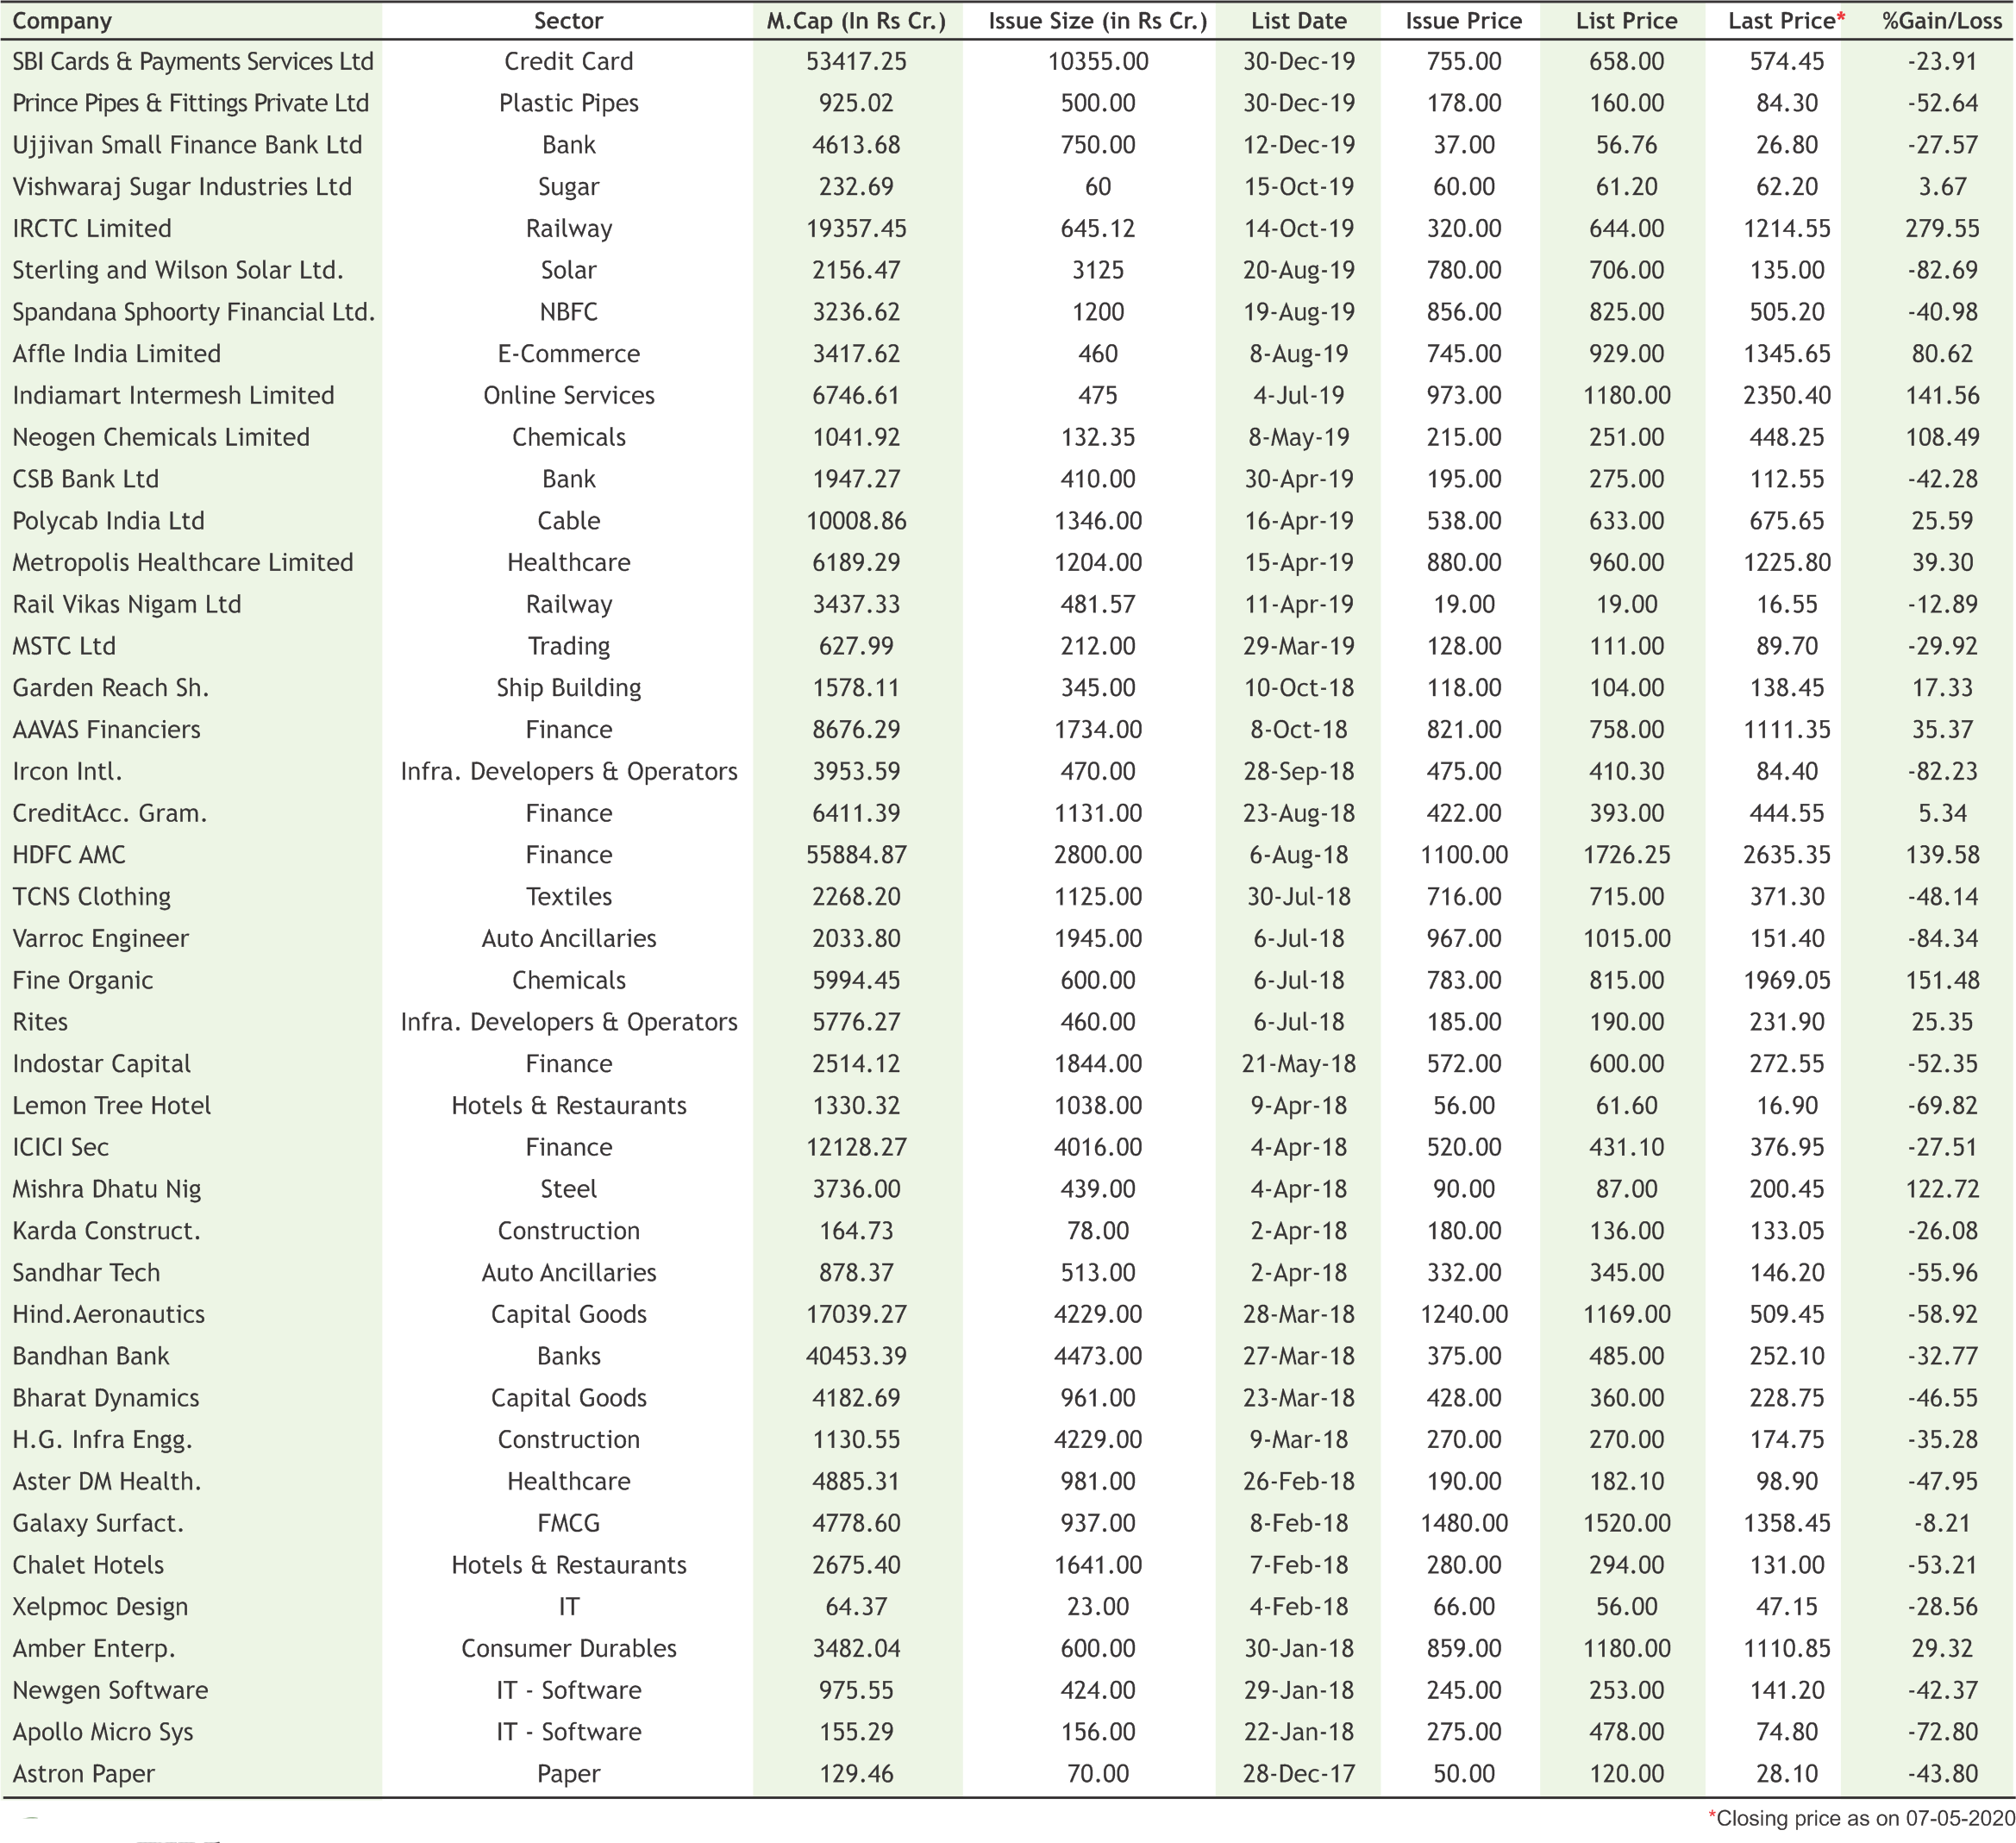
IPO NEWS


Sequoia-backed Stove Kraft gets SEBI nod for second attempt at IPO

Kitchen appliances manufacturer Stove Kraft Ltd has received regulatory nod to float an initial public offering, in what will be its second attempt to go public after its previous approval lapsed. The SEBI issued final observations to Stove Kraft’s revised IPO proposal on April 30. This takes the number of companies to have received regulatory clearances so far this year to 16. SEBI had cleared 28 IPO proposals last year, 72 in 2018 and 46 in 2017. Stove Kraft, which is backed by venture capital and growth-equity investment firm Sequoia Capital, had re-filed in February. It had originally filed its draft red herring prospectus in September 2018 and received regulatory approval in January 2019. SEBI’s IPO approval is valid for one year, and Stove Kraft’s application lapsed in January this year. The company didn’t change the IPO size in the revised proposal. Stove Kraft plans to raise Rs 145 crore ($20.35 million) by selling fresh shares while its promoters and Sequoia will sell 7.16 million shares in the IPO. Sequoia is looking to sell its entire stake in the company. It had invested in the Bengaluru-based company in two tranches, with the initial investment deal in 2010. It put in a total of Rs 110 crore in 2010 and topped it up three years later. It owns a stake of around 25.37% in the company. A successful IPO and listing will see Stove Kraft join listed peers such as TTK Prestige, Butterfly Gandhimati and Hawkins.

IPO TRACKER


15

FIXED DEPOSIT MONITOR


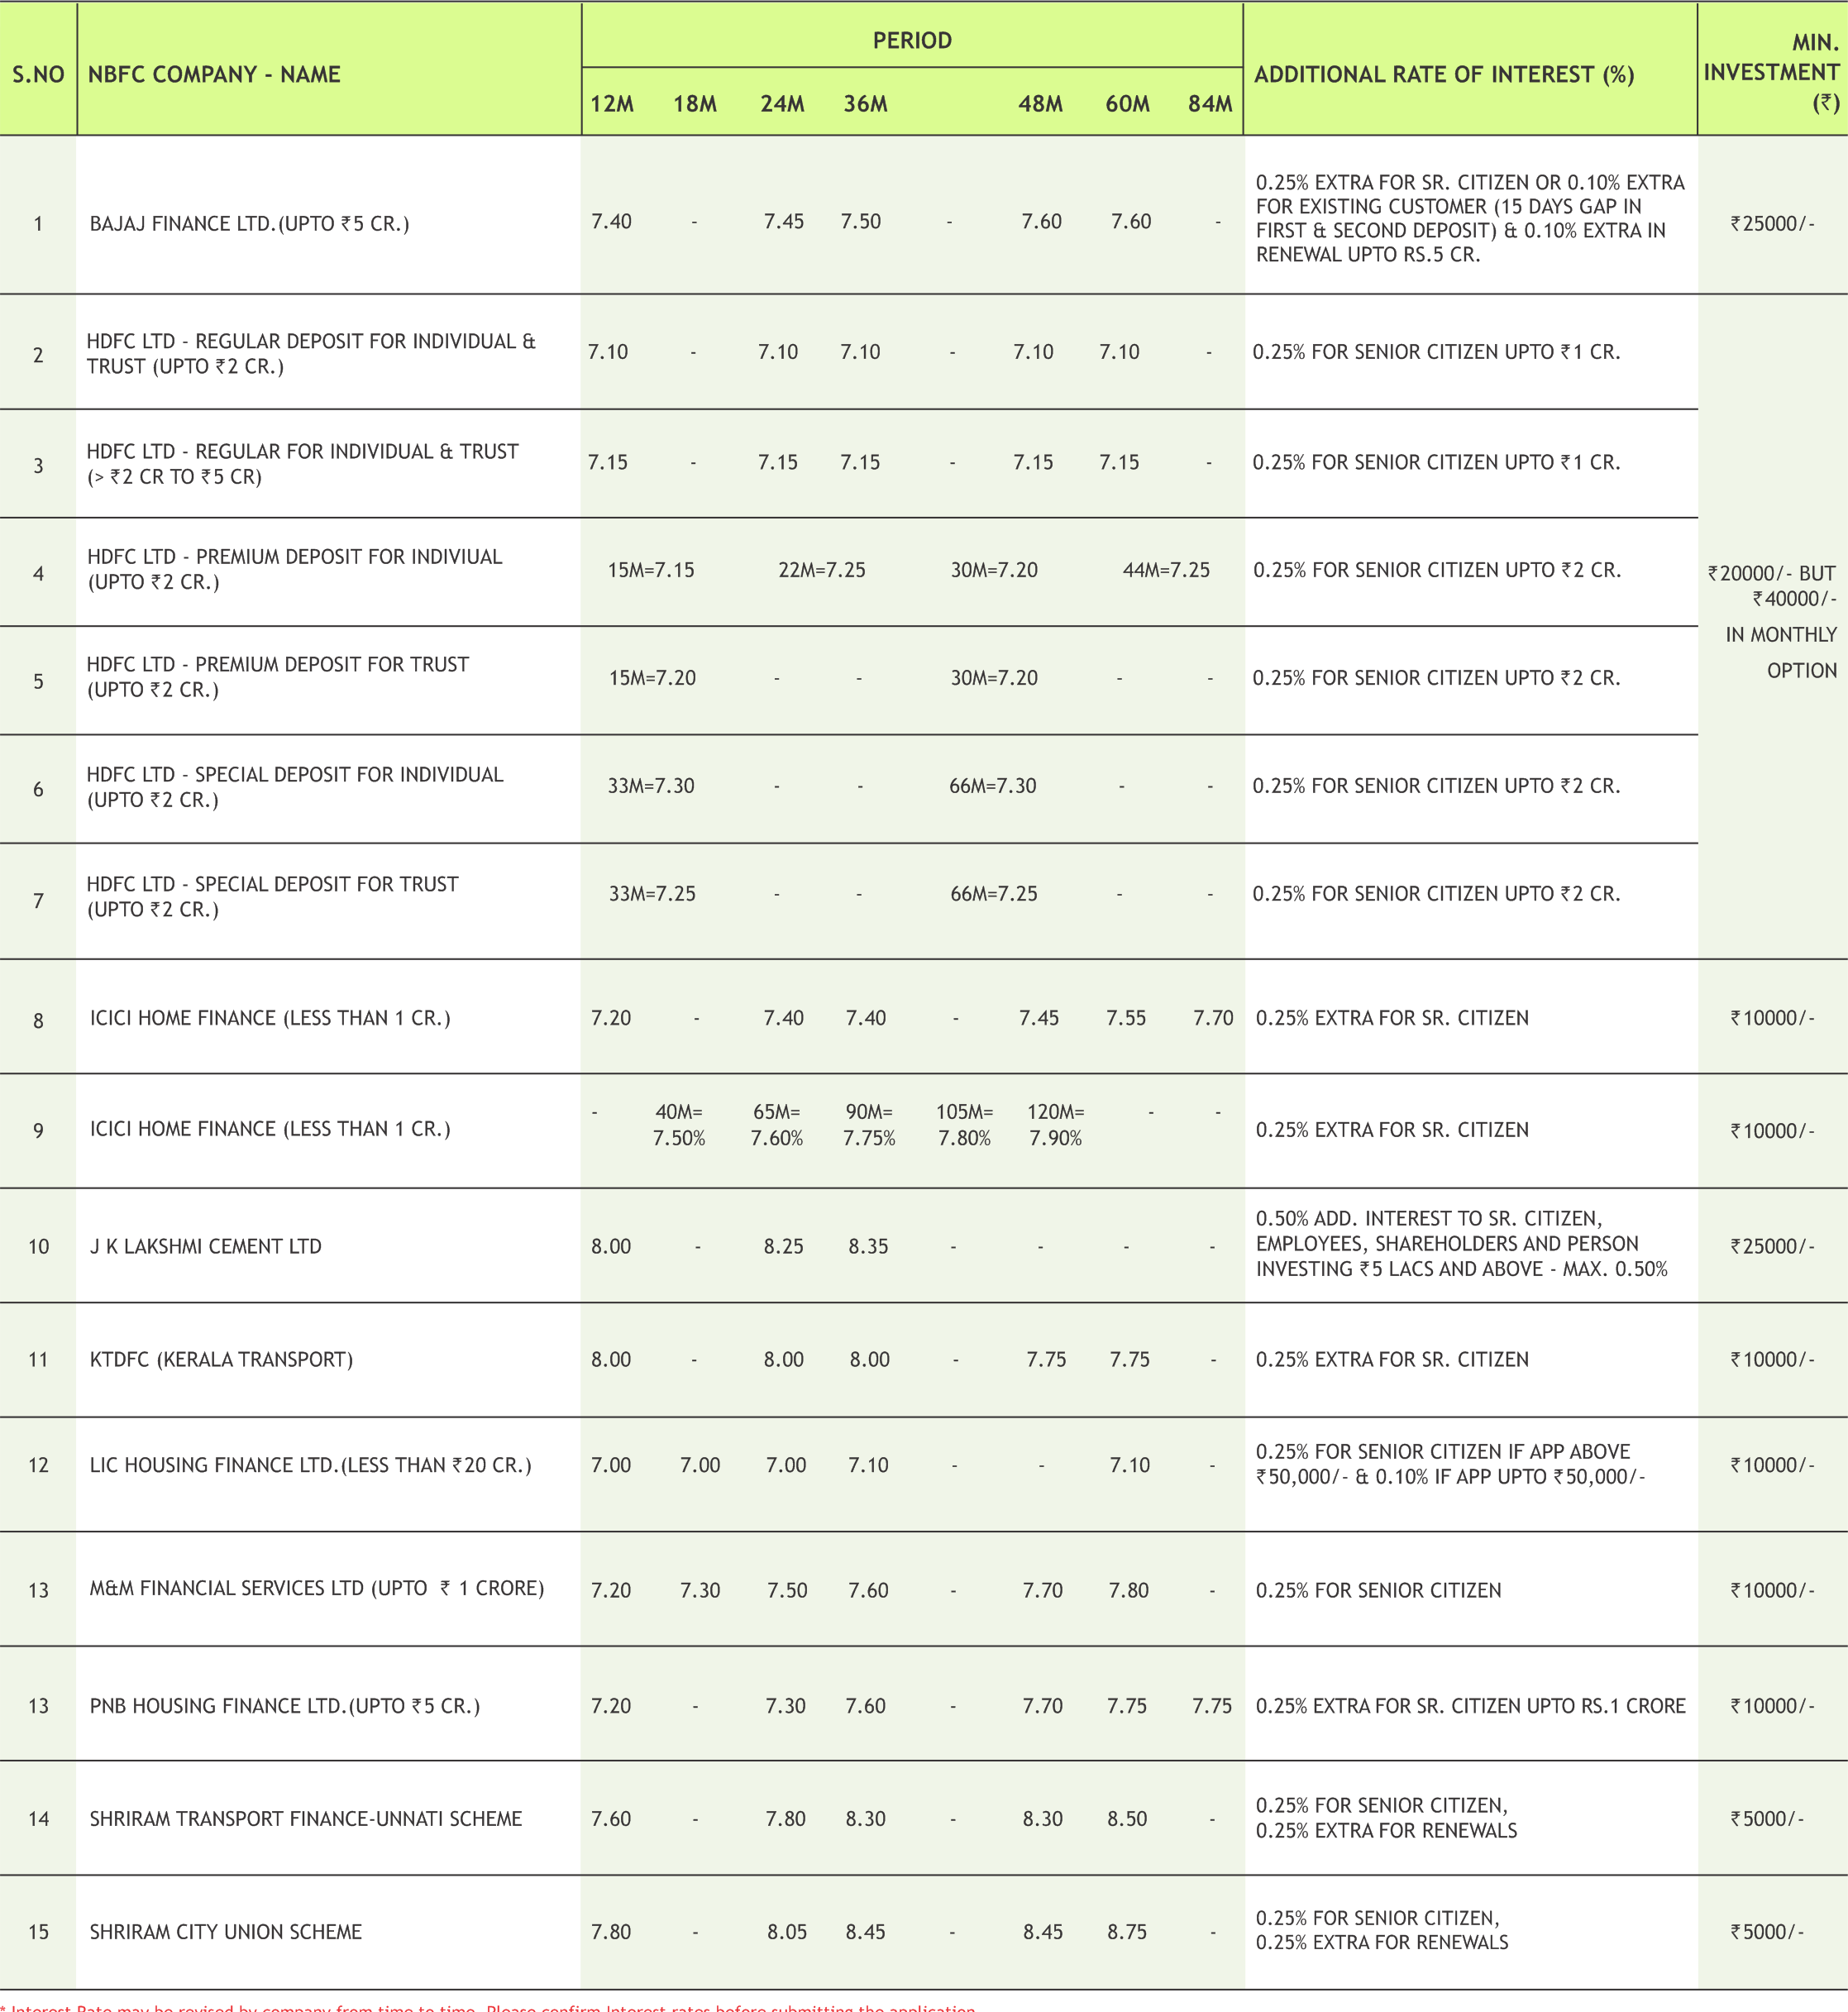
FIXED DEPOSIT COMPANIES


* Interest Rate may be revised by company from time to time. Please confirm Interest rates before submitting the application.

* For Application of Rs.50 Lac & above, Contact to Head Office.

* Email us at fd@smcindiaonline.com

16

MUTUAL FUND


INDUSTRY & FUND UPDATE

Inflows into equity mutual funds plunges 27% to Rs 81,600 crore in FY20

Investors pumped Rs 81,600 crore into equity-oriented mutual fund (MF) schemes in 2019-20, registering a decline of 27 per cent from Rs 1.12 lakh crore inflows in the preceding fiscal. However, this was the sixth successive year of net inflows in equity mutual funds, according to data by the Association of Mutual Funds in India (AMFI). The flows into equity funds in the last fiscal were lower than the flows in 2018-19, primarily due to the equity markets displaying volatility which made some investors take a break from making fresh equity investments. According to the data, net inflows into equity funds, which also include equity-linked saving schemes (ELSS), were Rs 81,600 crore in the last fiscal as against Rs 1,11,858 crore in 2018- 19. Net inflows in these funds were Rs 1,71,069 crore in 2017-18, Rs 70,367 crore in 2016-17, Rs 74,024 crore in 2015-16 and Rs 71,029 crore in 2014- 15. However, they had witnessed a net outflow of Rs 9,269 crore in 2013-14. Of the total inflow in the latest fiscal, investors poured Rs 11,485 crore in March, which was the highest level in the year. Also, they had invested Rs 10,730 crore in February, the highest level in 11 months.

Mutual fund NFOs hit by COVID19 pandemic; new launches postponed

In March, Sebi received just a single New Fund Offer (NFO) filing request, from Nippon India Mutual Fund. A month later, in May, SBI Mutual Fund filed for two NFOs. Interestingly, both these requests were for passive funds. The Coronavirus pandemic has hit the number of NFO requests from fund houses since January this year. There were 11 NFO filings in January, which fell to 6 in the March and to 2 in May. According to mutual fund participants, fund houses have put on hold their plans to launch new products due to the coronavirus pandemic. As coronavirus spread beyond continents and in India, the stock markets across the world started to fall.

SEBI eases compliance norms for liquid funds

Markets regulator SEBI gave three more months till June 30 for liquid funds to comply with the requirement of holding at least 20 percent of their assets in liquid assets like cash and government securities. Besides, the timelines for submission of cyber security audit reports as mandated by SEBI has been extended by two months till August 31, Securities and Exchange Board of India (SEBI) said in a circular. Also, the timelines for filing scheme annual reports for 2019-20 has been extended by one month till August 31, it added. The new rule, aimed at improving risk management and ensuring sufficient liquidity, was to become effective from April 1. Further, the regulator has given more time till June 30 for complying with the norms pertaining to amortisation based valuation for money market and debt securities.

After RBI infusion, net redemptions under Credit Risk Funds down by 81.5%, claims AMFI

The Association of Mutual Funds in India (AMFI) on May 3 claimed that net redemptions under Credit Risk Funds have dropped 81.5 percent after the Reserve Bank of India (RBI) announced a special liquidity measure of Rs 50,000 crore for the mutual fund industry. Net redemptions under Credit Risk Funds stood at Rs 2,949.49 crore as on April 24 and peaked at Rs 4,294.36 crore on April 27, AMFI has said. Thereafter, for three days — April 28, 29 and 30 — the Net Redemptions under Credit Risk Funds stood at Rs 1,847.29 crore, Rs 1,251.17 crore and Rs 793.99 crore, respectively.

RBI extends regulatory benefits under SLF-MF to all banks

The Reserve Bank of India (RBI) extended the regulatory benefits under the special liquidity facility for mutual funds (SLF-MF) to all banks. The banks claiming the regulatory benefits would be required to submit a weekly statement, the central bank said in its release. “Based on requests received from banks, it has now been decided that the regulatory benefits announced under the SLF-MF scheme will be extended to all banks, irrespective of whether they avail funding from the Reserve Bank or deploy their own resources under the mentioned scheme,” RBI said. Earlier, the RBI had provided a Rs 50,000-crore shot in the arm to stressed mutual funds by unveiling a special liquidity facility for the sector, days after Franklin Templeton Mutual Fund decided to close six debt schemes.

Manulife Investment Management acquires 49 percent in Mahindra AMC

Mahindra & Mahindra Financial Services Limited (Mahindra Finance), completed the proceedings for divestment of 49 percent stake in its whollyowned subsidiary, Mahindra Asset Management Company Private Limited (Mahindra AMC), to Manulife*, a leading global financial services group. Manulife has invested US$ 35 million (~INR 265 crore) in the 51:49 joint venture, which aims to expand its fund offerings, drive fund penetration, and achieve long term wealth creation in India. The joint venture brings together Mahindra Finance's domestic market strength and track record of building successful businesses and partnerships, with Manulife's global wealth and asset management capabilities and richness of experience in servicing the needs of consumers in Asia and around the world across developed and developing markets. Manulife is a leading international financial services group, providing wealth and asset management and life insurance solutions for individuals, groups and institutions around the world, with assets under management and administration of over US$ 915 billion as of December 31, 2019.

17

MUTUAL FUND

Performance Charts


EQUITY (Diversified)
TAX Fund
BALANCED
INCOME FUND
SHORT
Due to their inherent short term nature, Short term funds have been sorted on the basis of 6month returns

Note:Indicative corpus are including Growth & Dividend option . The above mentioned data is on the basis of 08/08/2019 Beta, Sharpe and Standard Deviation are calculated on the basis of period: 1 year, frequency: Weekly Friday, RF: 7%


*Mutual Fund investments are subject to market risks, read all scheme related documents carefully

18

www.smcfinance.com

FOCUS ON YOUR BUSINESS,NOT FINANCE

Get easy business loans with SMC Finance

At SMCCHANGE IN BANKNIFTY OPTION OI (IN QTY) (MONTHLY) Finance, We make it easy for you to get a loan. Whether you are expanding your business, upgrading new equipments or for working capital. We are here to help you grow fast.

Professional and Transparent approach

Quick loan approval & disbursal

Hassle-free documentation process

Attractive Rate of Interest

Call Toll-Free 1800118818

E-mail nbfccare@smcfinance.com

Medical Equipment Finance | Personal Loan | Loan Against Property | Loan Against Shares/Mutual Funds/Bonds | MSME/SME Financing | Lease Rental Discounting | Promoter Financing | Debtors Financing | Structured Financing | Affordable Housing Application Financing | IPO/ NCD Financing | Business Loan

Moneywise Financial Services Pvt. Ltd. (A wholly owned subsidiary of SMC Global Securities Ltd.) Corporate Office: 11/6-B, 2nd Floor, Pusa Road, New Delhi 110005, Tel. +91-11-30111000, CIN No.: U51909WB1996PTC078352

SMC GROUP PRESENCE:

SMC GLOBAL SECURITIES LTD.

REGISTERED OFFICES:

11 / 6B, Shanti Chamber, Pusa Road, New Delhi 110005. Tel: 91-11-30111000, Fax: 91-11-25754365

MUMBAI OFFICE:

Lotus Corporate Park, A Wing 401 / 402 , 4th Floor , Graham Firth Steel Compound, Off Western Express Highway, Jay Coach Signal, Goreagon (East) Mumbai - 400063

Tel: 91-22-67341600, Fax: 91-22-67341697

KOLKATA OFFICE:

18, Rabindra Sarani, Poddar Court, Gate No-4,5th Floor, Kolkata-700001 Tel.: 033 6612 7000/033 4058 7000, Fax: 033 6612 7004/033 4058 7004

AHMEDABAD OFFICE :

10/A, 4th Floor, Kalapurnam Building, Near Municipal Market, C G Road, Ahmedabad-380009, Gujarat

Tel : 91-79-26424801 - 05, 40049801 - 03

CHENNAI OFFICE:

Salzburg Square, Flat No.1, III rd Floor, Door No.107, Harrington Road, Chetpet, Chennai - 600031.

Tel: 044-39109100, Fax -044- 39109111

SECUNDERABAD OFFICE:

315, 4th Floor Above CMR Exclusive, BhuvanaTower, S D Road, Secunderabad, Telangana-500003

Tel : 040-30031007/8/9

DUBAI OFFICE:

2404, 1 Lake Plaza Tower, Cluster T, Jumeriah Lake Towers, PO Box 117210, Dubai, UAE

Tel: 97145139780 Fax : 97145139781

Email ID : pankaj@smccomex.com

smcdmcc@gmail.com

Printed and Published on behalf of

Mr. Saurabh Jain @ Publication Address

11/6B, Shanti Chamber, Pusa Road, New Delhi-110005

Website: www.smcindiaonline.com

Investor Grievance : igc@smcindiaonline.com

Printed at: S&S MARKETING

102, Mahavirji Complex LSC-3, Rishabh Vihar, New Delhi - 110092 (India) Ph.: +91-11- 43035012, 43035014, Email: ss@sandsmarketing.in