2019: Issue 708, Week: 4th - 8th November
A Weekly Update from SMC (For private circulation only)
WISE M NEY
NEY


2019: Issue 708, Week: 4th - 8th November
A Weekly Update from SMC (For private circulation only)
 NEY
NEY 


| Equity | 4-7 |
| Derivatives | 8-9 |
| Commodity | 10-13 |
| Currency | 14 |
| IPO | 15 |
| FD Monitor | 16 |
| Mutual Fund | 17-18 |
I
n the week gone by, the global stock markets remained cautious after the news I that Chinese officials doubted whether a trade deal would get done and worries about the US-China trade situation prompted market participants to remain side line. Meanwhile, investors also continued to digest the Federal Reserve’s latest interest rate cut and commentary, as well as a host of major corporate quarterly results as earnings season rolled on. The Fed cut interest rates for a third time this year on Wednesday to help sustain U.S. growth, but signalled that further stance would depend on economic data. Although the Fed acknowledged risks facing the global economy, it also said America was still doing well in comparison. Meanwhile, the US economy grew at an annualized rate of 1.9% in the third quarter whereas Eurozone growth holds at weak 0.2pc, but beats predictions of further slowdown.
Back at home, domestic market continued to move higher on better than expected results from India Inc. and festive cheer. Also the foreign players were seen putting in new money in the market. There is an expectation that the government may announce a slew of market-friendly sops in coming days also added to the sentiment. It could be seen that consumer buying has returned this festive season. Meanwhile, the output o f core infrastructure industries shrank by 5.2 per cent in September, as against an expansion of 4.3 per cent in the corresponding period a year ago. Seven of eight sectors witnessed negative growth. According to a report from the Economist Intelligence Unit, India and China are projected to see accelerated economic growth in the fourth quarter of this year, bucking trends in the US and the European Union. Going forward, markets are expected to take cues from both domestic and global factors.
On the commodity market front, Interest rate cut by US Federal Reserve and uncertainty regarding US China trade deal will help the bullion counter to continue its upside momentum. Gold may test 39300 levels while taking support near 38100 levels while silver may test 48000 levels while taking support near 45500 levels. Crude oil prices may continue to witness range bound movement as increased global production and uncertainty regarding US China trade deal to prices under pressure while coordinated oil output cut by OPEC to cap the downside. Natural gas may witness further upside momentum as the weather is expected to be much colder than normal especially in the mid-west for the next 6-10 and 8-14 days driving up heating demand. Base metals counter to remain under pressure on increasing stockpiles and decline in demand. Copper may trade sideways as it can face resistance near 450 levels and support near 435. This week US factory orders, Trade balance, Markit composite PMI, ISM non manufacturing PMI, Jolt job openings, consumer credit, Michigan consumer sentiment Euro German manufacturing PMI, Euro retail sales are some very important triggers for this week.
“May the auspicious festival of lights, beautifully illuminate every corner of your life by adding sparkling moments of Love, Happiness, Success, and Joy. May you enjoy this festival with your loved ones with high spirits”.
Happy investing!!!

SMC Global Securities Ltd. (hereinafter referred to as “SMC”) is a registered Member of National Stock Exchange of India Limited, Bombay Stock Exchange Limited and its associate is member of MCX stock Exchange Limited. It is also registered as a Depository Participant with CDSL and NSDL. Its associates merchant banker and Portfolio Manager are registered with SEBI and NBFC registered with RBI. It also has registration with AMFI as a Mutual Fund Distributor.
SMC is a SEBI registered Research Analyst having registration number INH100001849. SMC or its associates has not been debarred/ suspended by SEBI or any other regulatory authority for accessing /dealing in securities market.
SMC or its associates including its relatives/analyst do not hold any financial interest/beneficial ownership of more than 1% in the company covered by Analyst. SMC or its associates and relatives does not have any material conflict of interest. SMC or its associates/analyst has not received any compensation from the company covered by Analyst during the past twelve months. The subject company has not been a client of SMC during the past twelve months. SMC or its associates has not received any compensation or other benefits from the company covered by analyst or third party in connection with the research report. The Analyst has not served as an officer, director or employee of company covered by Analyst and SMC has not been engaged in market making activity of the company covered by Analyst.
The views expressed are based solely on information available publicly available/internal data/ other reliable sources believed to be true.
SMC does not represent/ provide any warranty express or implied to the accuracy, contents or views expressed herein and investors are advised to independently evaluate the market conditions/risks involved before making any investment decision.
DOMESTIC NEWS
Economy
• According to the survey data from IHS Markit showed, India's manufacturing activity grew at the slowest pace in two years in October driven by weak orders and production. The headline IHS Markit manufacturing Purchasing Managers' Index, or PMI, decreased to 50.6 in October from 51.4 in September. However, any reading above 50 indicates expansion in the sector.
Pharmaceuticals
• Lupin Ltd is in advanced talks to sell its Japanese generics subsidiary Kyowa Pharmaceuticals for an enterprise value of $600 million to a local player as it steps up efforts to significantly cut operations in the world’s third largest pharma market. The name of the buyer could not be independently verified. People close to the discussions said that an announcement is expected in November.
Automobile
• Bajaj Auto and TVS Motor Co have settled a decade-old dispute related to a patent infringement case with the two companies withdrawing several pending proceedings from various courts and fora. In separate regulatory filings, the two companies said they have entered into a settlement agreement to amicably settle the decade-old dispute related to alleged infringement of Bajaj's patent for digital twin spark plug ignition technology.
FMCG
• Hindustan Unilever is bringing a new line of soaps, shampoos, conditioners and body cream from its global parent to tap into the growing trend for natural products and at the same time, align launches with its sustainability agenda. The local unit of Unilever will launch more than a dozen friendly personal care products under Love, Beauty and Planet brand, that are made from ethically and sustainably sourced ingredients with vegan-friendly formulations and packed in 100% recycled and recyclable bottles.
Information Technology
• Wipro has set up an engineering and innovation centre in Virginia, US, a move that will create 200 additional jobs in the Richmond area by 2021. Wipro employs over 500 professionals across Virginia of whom 420 are in the Richmond area.
• Adani Group is partnering with San Francisco-based Digital Realty to develop and operate data centre infrastructure across India. Under the agreement between Adani Enterprises and Digital Realty, the two parties will "jointly evaluate developing and operating data centres, data centre parks and cultivating undersea cable provider communities of interest across India.
Realty
• Dilip Buildcon has been declared L-1 bidder for the project viz. Construction of New Greenfield Airport at Hirasar, Rajkot, Gujarat by the Airport Authority of India on EPC basis.
Capital Goods
• Kirloskar Electric Company has entered into joint venture with Electrodrive Powertrain Solutions for purpose of design and development, sales and supply of electric motors to be used in all types of electric vehicles. The products which proposed Joint Venture will sell and supply will be manufactured solely by Kirloskar Electric Company, the necessary product information, data required for the manufacturing process shall be provided by Joint Venture to the Kirloskar Electric Company.
INTERNATIONAL NEWS
• The Federal Reserve cut interest rates for the third time this year, reversing nearly all of 2018’s rate increases as uncertainty from President Trump’s trade war and slowing global growth continue to pose risks to the United States economy. The Fed announced its widely expected decision to lower the target range for the federal funds rate by 25 basis points to 1-1/2 to 1-3/4 percent.
• The Federal Reserve cut interest rates for the third time this year, reversing nearly all of 2018’s rate increases as uncertainty from President Trump’s trade war and slowing global growth continue to pose risks to the United States economy. The Fed announced its widely expected decision to lower the target range for the federal funds rate by 25 basis points to 1-1/2 to 1-3/4 percent.
• US initial jobless claims rose to 218,000, an increase of 5,000 from the previous week's revised level of 213,000. Economists had expected jobless claims to inch up to 215,000 from the 212,000 originally reported for the previous week.
• Eurozone's inflation slowed in October to its lowest level in nearly three years, flash estimates from the Eurostat. The consumer price index rose 0.7 percent year-on-year following a 0.8 percent increase in September. The inflation rate was in line with economists' expectations.
• Eurozone's inflation slowed in October to its lowest level in nearly three years, flash estimates from the Eurostat. The consumer price index rose 0.7 percent year-on-year following a 0.8 percent increase in September. The inflation rate was in line with economists' expectations.
| Stocks | *Closing Price | Trend | Date Trend Changed | Rate Trend Changed | SUPPORT | RESISTANCE | Closing S/l |
|---|---|---|---|---|---|---|---|
| S&P BSE SENSEX | 40165 | UP | 08.02.19 | 36546 | 36300 | 35300 | |
| NIFTY50 | 11891 | UP | 08.02.19 | 10944 | 10900 | 10600 | |
| NIFTY IT* | 15483 | UP | 21.07.17 | 10712 | 15200 | 14800 | |
| NIFTY BANK | 30364 | UP | 30.11.18 | 26863 | 27700 | 27000 | |
| ACC | 1544 | DOWN | 04.10.19 | 1488 | 1560 | 1590 | |
| BHARTIAIRTEL | 373 | UP | 15.03.19 | 338 | 360 | 345 | |
| BPCL | 520 | UP | 30.08.19 | 355 | 470 | 450 | |
| CIPLA | 469 | UP | 25.10.19 | 460 | 430 | 420 | |
| SBIN | 314 | UP | 01.11.19 | 314 | 285 | 275 | |
| HINDALCO | 194 | DOWN | 04.10.19 | 182 | 195 | 198 | |
| ICICI BANK | 463 | UP | 20.09.19 | 418 | 435 | 420 | INFOSYS | 689 | DOWN | 25.10.19 | 637 | 690 | 720 |
| ITC* | 262 | DOWN | 31.05.19 | 279 | - | 270 | |
| L&T | 1449 | UP | 20.09.19 | 1412 | 1449 | 1449 | |
| MARUTI | 7600 | UP | 13.09.19 | 6450 | 7100 | 6900 | |
| NTPC | 122 | DOWN | 16.08.19 | 118 | 126 | 130 | |
| ONGC | 145 | UP | 20.09.19 | 134 | 134 | 130 | |
| RELIANCE | 1456 | UP | 16.08.19 | 1278 | 1350 | 1320 | |
| TATASTEEL | 396 | UP | 01.11.19 | 396 | 370 | 355 | |
*ITC has breached the resistance of 260
Closing as on 01-11-2019
NOTES:
1) These levels should not be confused with the daily trend sheet, which is sent every morning by e-mail in the name of "Morning Mantra ".
2) Sometimes you will find the stop loss to be too far but if we change the stop loss once, we will find more strength coming into the stock. At the moment, the stop loss will be far as we are seeing the graphs on weekly basis and taking a long-term view and not a short-term view.
| Meeting Date | Company | Purpose |
|---|---|---|
| 30/10/2019 | L&T Technology Services | Interim Dividend - Rs 7.50 Per Sh |
| 5/11/2019 | Colgate-Palm. | 1200% 1st Interim Dividend |
| 7/11/2019 | Shriram Trans. | 50% Interim Dividend |
| 7/11/2019 | Petronet LNG | 55% Special Interim Dividend |
| Ex-Date | Company | Purpose |
|---|---|---|
| 4/11/2019 | H D F C | Quarterly Results |
| 4/11/2019 | Bharat Electron | Quarterly Results |
| 5/11/2019 | Apollo Tyres | Quarterly Results |
| 5/11/2019 | Berger Paints | Quarterly Results |
| 5/11/2019 | Titan Company | Quarterly Results |
| 5/11/2019 | NCC | Quarterly Results |
| 5/11/2019 | Dabur India | Quarterly Results,Interim Dividend |
| 5/11/2019 | Punjab Natl.Bank | Quarterly Results |
| 5/11/2019 | Tech Mahindra | Quarterly Results |
| 5/11/2019 | REC Ltd | Quarterly Results |
| 5/11/2019 | Torrent Power | Quarterly Results |
| 6/11/2019 | Cipla | Quarterly Results |
| 6/11/2019 | Tata Steel | Quarterly Results |
| 6/11/2019 | Lupin | Quarterly Results |
| 6/11/2019 | Canara Bank | Quarterly Results |
| 7/11/2019 | B P C L | Quarterly Results |
| 7/11/2019 | H P C L | Quarterly Results |
| 7/11/2019 | Sun Pharma.Inds. | Quarterly Results |
| 7/11/2019 | Indraprastha Gas | Quarterly Results |
| 7/11/2019 | B P C L | Quarterly Results |
| 7/11/2019 | United Breweries | Quarterly Results |
| 8/11/2019 | Ashok Leyland | Quarterly Results |
| 8/11/2019 | Bharat Forge | Quarterly Results |
| 8/11/2019 | Eicher Motors | Quarterly Results |
| Quarterly Results | M & M | Quarterly Results |
| 8/11/2019 | Tata Power Co. | Quarterly Results |
| 8/11/2019 | Bank of Baroda | Quarterly Results |
| 8/11/2019 | GAIL (India) | Quarterly Results |

4


5
Cholamandalam Investment and Finance Company Limited
CMP: 305.00
Target Price: 368
Upside: 21%
| Current Mkt.Price (Rs.) | 305.00 |
| Face Value (Rs.) | 2.00 |
| 52 Week High/Low | 322.20/218.29 |
| M.Cap (Rs. in Cr.) | 23846.29 |
| EPS (Rs.) | 15.54 |
| P/E Ratio (times) | 19.63 |
| P/B Ratio (times) | 3.86 |
| Stock Exchange | BSE |
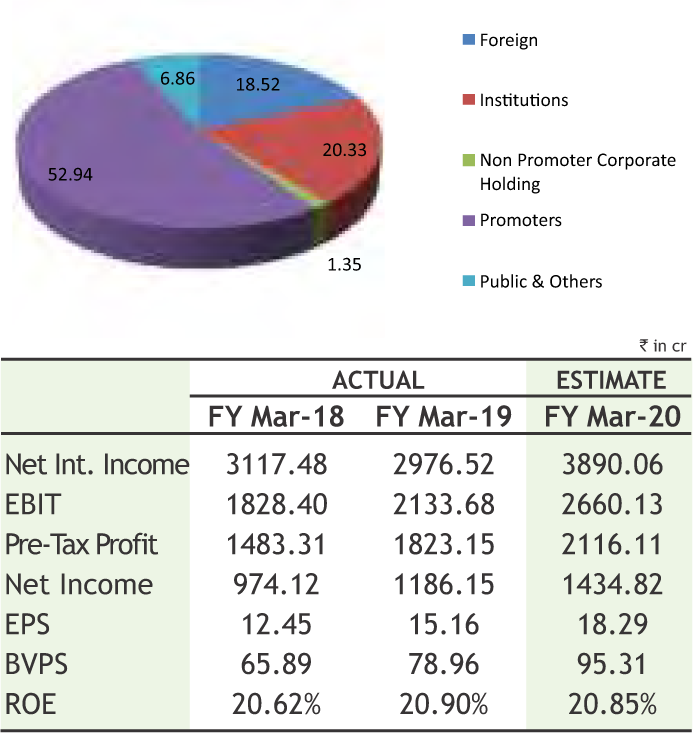
Investment Rationale
• Cholamandalam Investment is a comprehensive financial services provider offering vehicle finance, home loans, home equity loans, SME loans, investment advisory services and stock broking solutions.
• In Q1 FY20, aggregate disbursements were at Rs. 8,572 Cr as against Rs. 7,014 Cr in the previous year registering a growth of 22%. Vehicle Finance (VF) business has clocked a volume of Rs. 6,940 in Q1 FY20 as against Rs. 5,715 Cr, reporting a growth of 21% Y-o-Y. The Home Equity (HE) business disbursed Rs. 1,101 Cr as against Rs. 939 Cr for Q1 FY19, marking a growth of 17% Y-o-Y. Its AUM grew by 35% at Rs. 62,827 Cr as compared to Rs. 46,709 Cr YoY.
• In Q1 FY20, aggregate disbursements were at Rs. 8,572 Cr as against Rs. 7,014 Cr in the previous year registering a growth of 22%. Vehicle Finance (VF) business has clocked a volume of Rs. 6,940 in Q1 FY20 as against Rs. 5,715 Cr, reporting a growth of 21% Y-o-Y. The Home Equity (HE) business disbursed Rs. 1,101 Cr as against Rs. 939 Cr for Q1 FY19, marking a growth of 17% Y-o-Y. Its AUM grew by 35% at Rs. 62,827 Cr as compared to Rs. 46,709 Cr YoY.
• Spreads remained stable on a QoQ basis, while it declined 108bp YoY. NIMs at 6.7% declined 60bp YoY due to 50bp yield compression and 20bp increase in cost of funds. Borrowing mix largely remained unchanged, barring debentures (share reduced to 17% from 21% sequentially) and term loans (share increased to 56% as against 53% in the previous quarter).
• The company has a diversified portfolio, both geographically and product-wise. It is expanding into new segments like home loans and MSME
financing. With strong branch expansion and focus on new products, management expects to achieve a mid-teen AUM growth over the medium term, despite sluggish OEM volumes.
Risk
• Asset Quality deterioration
• Lower margins due to intense competition
Valuation
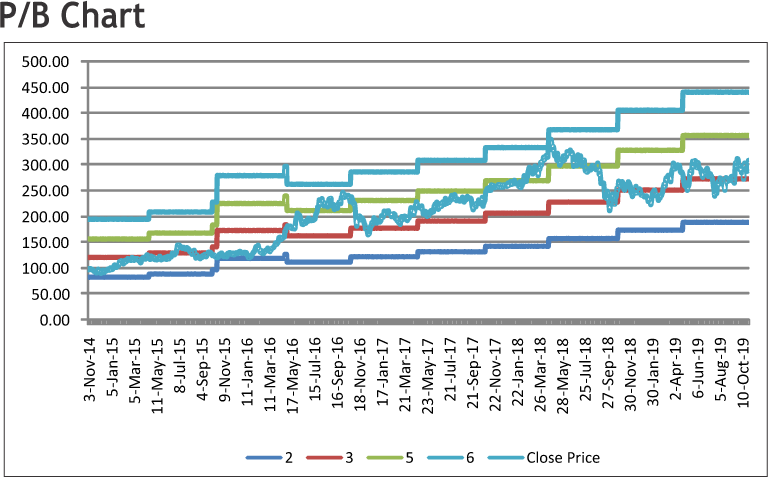
According to the management, the company was able to clock a robust growth in AUM of over 30%. The company, having seen similar business cycles in the past, is well equipped to manage the concerns emerging from auto sector slowdown and continue its growth trajectory. The Home Equity and the Home Loan businesses are also clocking steady growth – the exit of other weaker players from the market has led to a higher customer retention and disbursement growth in these businesses. It remains cautiously optimistic of its growth plans. Thus, it is expected that the stock will see a price target of Rs. 368 on a P/BV multiple of 3.86 times its FY 20E BV of 95.31.
Heidelberg Cement India Limited
CMP: 187.35
Target Price: 227
Upside: 21%
| Face Value (Rs.) | 10.00 |
| 52 Week High/Low | 217.60/138.25 |
| M.Cap (Rs. in Cr.) | 4245.60 |
| EPS (Rs.) | 11.33 |
| P/E Ratio (times) | 16.54 |
| P/B Ratio (times) | 3.46 |
| Dividend Yield (%) | 2.14 |
| Stock Exchange | BSE |
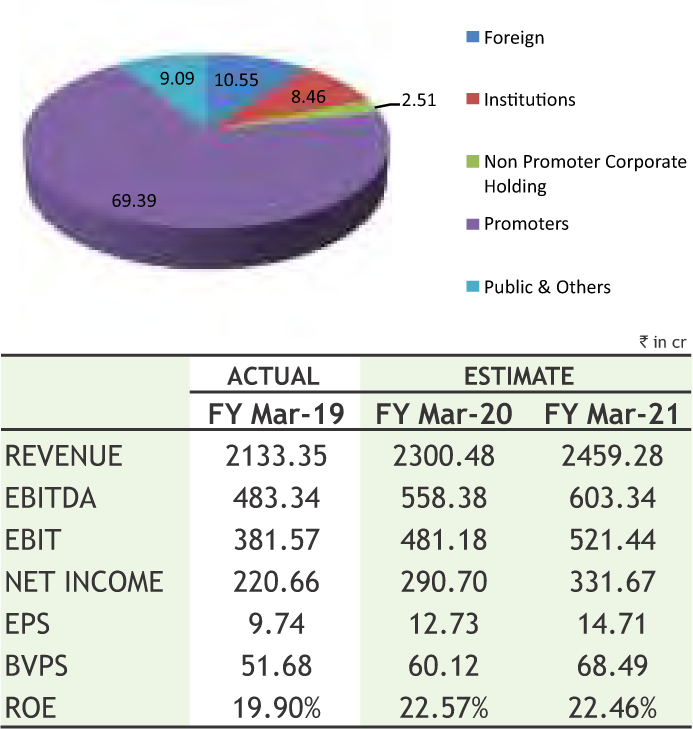
Investment Rationale
• Heidelberg Cement is one of the world’s largest building materials companies. The Company's product portfolio includes Portland Pozzolana Cement (PPC) and Portland Slag cement (PSC). The Company's manufacturing facilities are located in Ammasandra, Karnataka; Damoh, Madhya Pradesh, and Jhansi, Uttar Pradesh. The Company has a total cement manufacturing capacity of 5.4 million tons per annum (MTPA), with clinker capacity of 3.4 MTPA.
• The company maintained capex guidance of Rs 50 crore for FY20. The company expects capacity debottlenecking would be completed by CY20 end. The company's current capacity was at 3.5 mt for clinker and grinding capacity would increase to 5.9 mt post de-bottlenecking operations.
• Steady volume growth, coupled with higher realizations and focus on cost efficiencies, aided operational performance of the company in Q2 FY20. The company continues to display superior business execution and appears to be in a sweet spot owing to its strategic location in the central region.
• During Q2FY20, Revenue up by 9% driven by strong pricing and solid volumes and 16.11% increase in net profit at Rs 58.15. It has reported an increase of 0.8 per cent in sales volume to 1,134 kilo tonnes as against 1,125 kilo tonnes in the year-ago quarter.
• Capacity utilization during the quarter was more than 80 per cent and increase in raw material, power and fuel costs were partially offset by lower freight and forwarding expenses. The company is actively looking for acquisition opportunities as there is limited scope for major expansion given the low limestone reserves. Management expects the demand outlook in Central region on the back of strong government spending on rural and
affordable housing/infrastructure sector and better sentiments remains positive.
Risk
• Limestone availability
• Weak Demand
Valuation
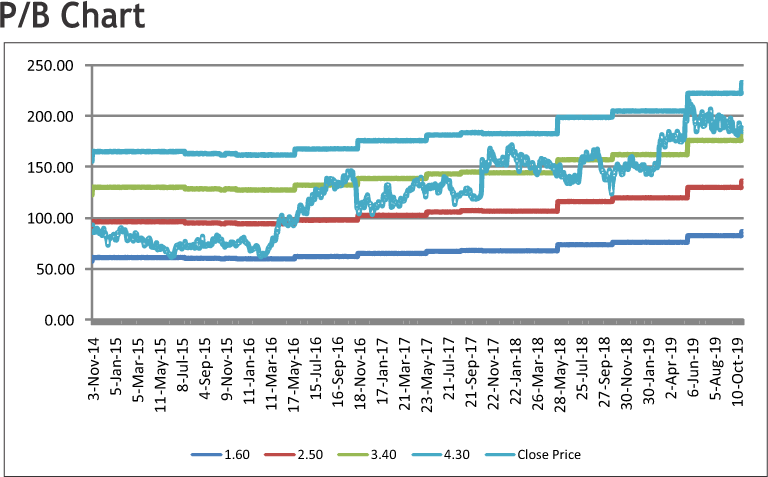
The management of the company expects demand to grow 6-7% in CY2019 and the growth would largely come from Tier-II/III cities. The company expects stability in Govt. will increase the speed of investments in infrastructure projects i.e. concrete roads, railways, metros, civil aviation, irrigation, mega Industrial and freight corridors etc. It has strong positioning in the central market and superior margin profile compared to peers. Firm cement prices in the central region and strong operating leverage will continue to aid earnings. The company has taken a slew of measures to cut down its production costs which will bore well going ahead. Thus, it is expected that the stock will see a price target of Rs.227 in 8 to 10 months time frame on 3 year average P/BV of 3.32x and FY20 expected book value (BVPS) of Rs.68.49.
Source: Company Website Reuters Capitaline
Above calls are recommended with a time horizon of 8 to 10 months.

6
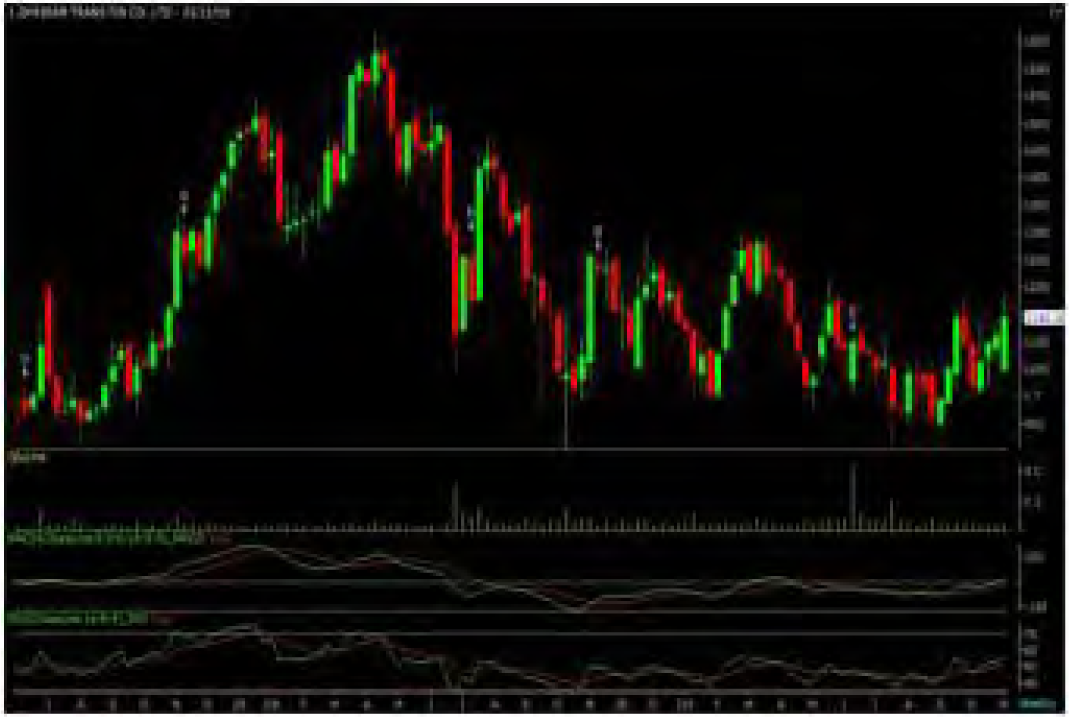
The stock closed at Rs 1144.10 on 01st November, 2019. It made a 52-week low of Rs 909.05 on 24th July 2019 and a 52-week high of Rs. 1297 on 13th March 2019. The 200 days Exponential Moving Average (DEMA) of the stock on the daily chart is currently at Rs 1098.16
As we can see on chart, that stock has consolidated in the range of 950 to 1150 levels for four months and formed an “Inverted Head and Shoulder” pattern on weekly charts, which is bullish in nature. Last week, stock ended with 3% gains and has managed to close on verge of neckline breakout of pattern so follow up buying can continue for coming days. Therefore, one can buy in the range of 1120-1130 levels for the upside target of 1240-1260 levels with SL below 1060 levels.
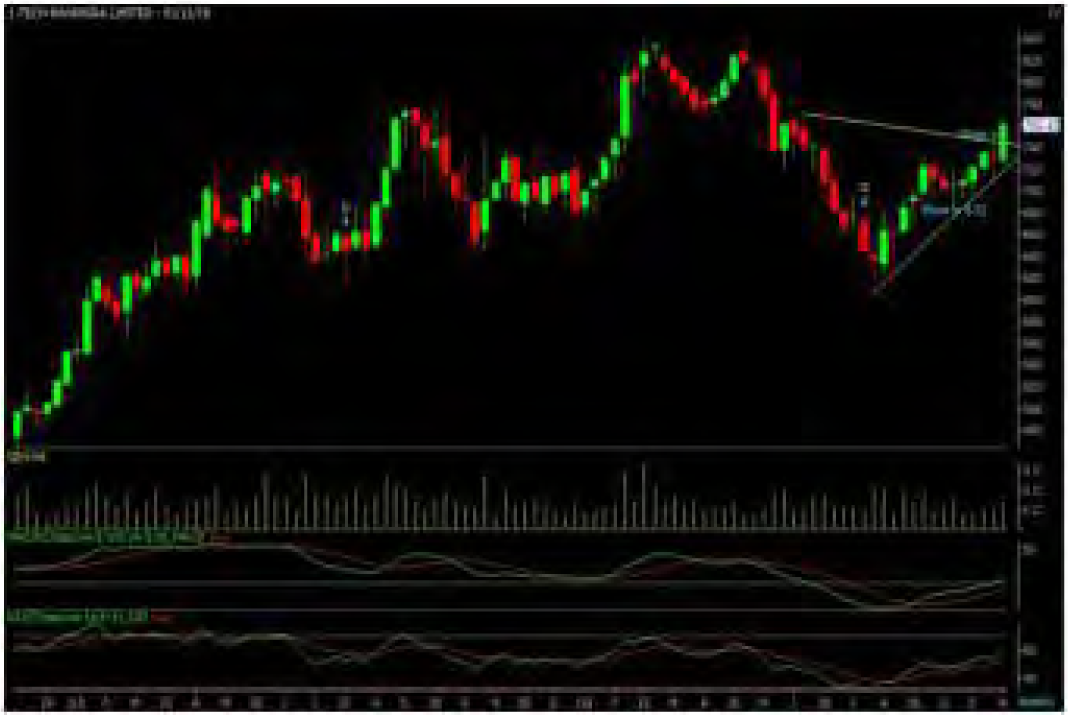
The stock closed at Rs 760.45 on 01st November, 2019. It made a 52-week low at Rs 607.15 on 31st July 2019 and a 52-week high of Rs. 846.50 on 02nd May 2019. The 200 days Exponential Moving Average (DEMA) of the stock on the daily chart is currently at Rs 716.54
Short term, medium term and long term bias are looking positive for the stock as it is trading in higher highs and higher lows on charts, which is considered to be bullish. Last week, stock ended over 4% gains and has given the breakout of downward sloping resistance line of Triangle pattern, closed above the same so buying momentum can continue in coming days. Therefore, one can buy in the range of 748-753 levels for the upside target of 820-840 levels with SL below 710.
Disclaimer : The analyst and its affiliates companies make no representation or warranty in relation to the accuracy, completeness or reliability of the information contained in its research. The analysis contained in the analyst research is based on numerous assumptions. Different assumptions could result in materially different results.
The analyst not any of its affiliated companies not any of their, members, directors, employees or agents accepts any liability for any loss or damage arising out of the use of all or any part of the analysis research.
SOURCE: CAPITAL LINE
Charts by Spider Software India Ltd
Above calls are recommended with a time horizon of 1-2 months

7
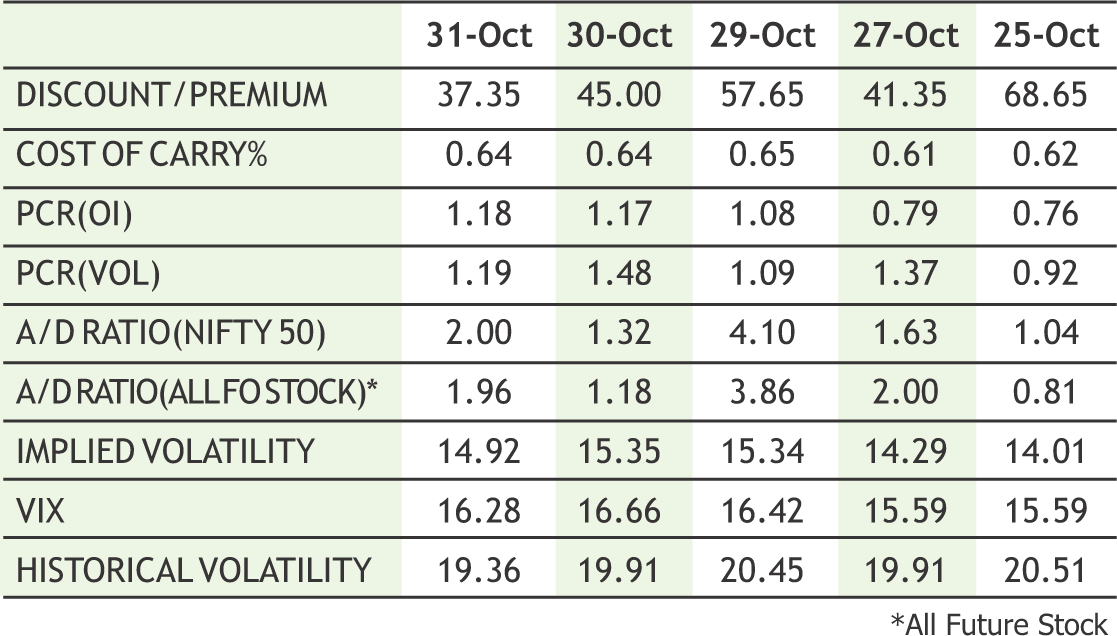
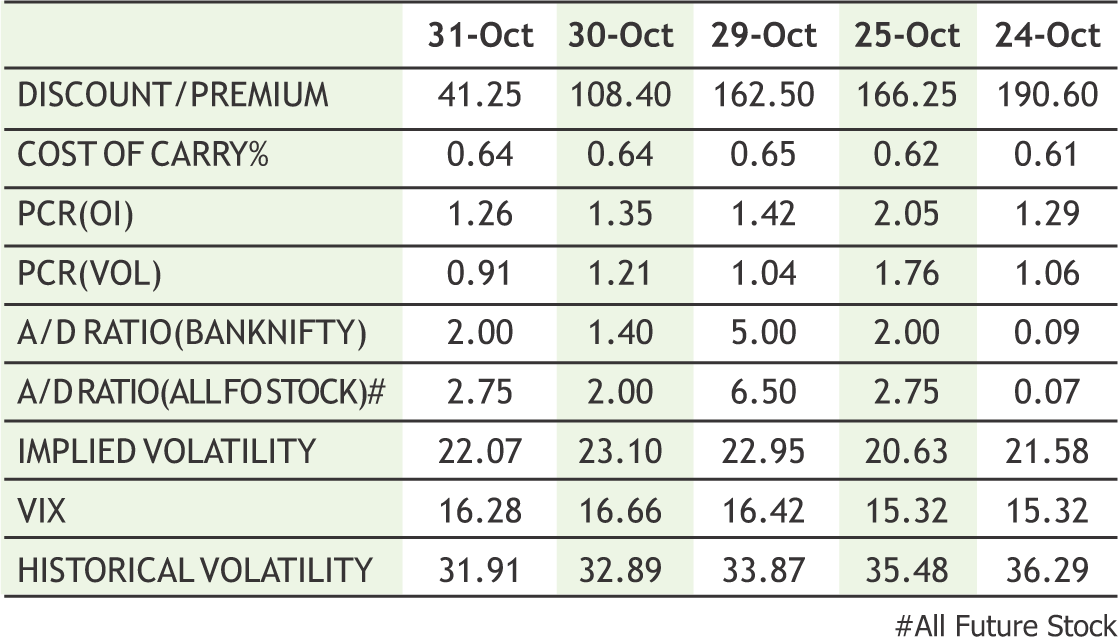
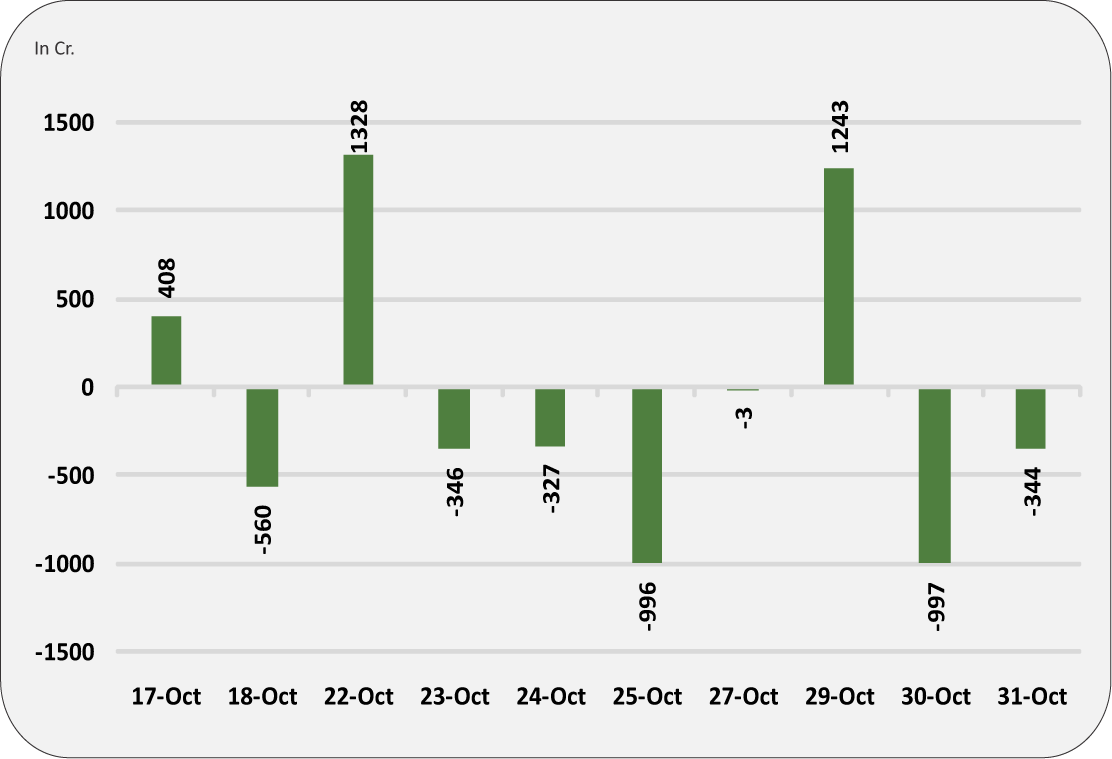
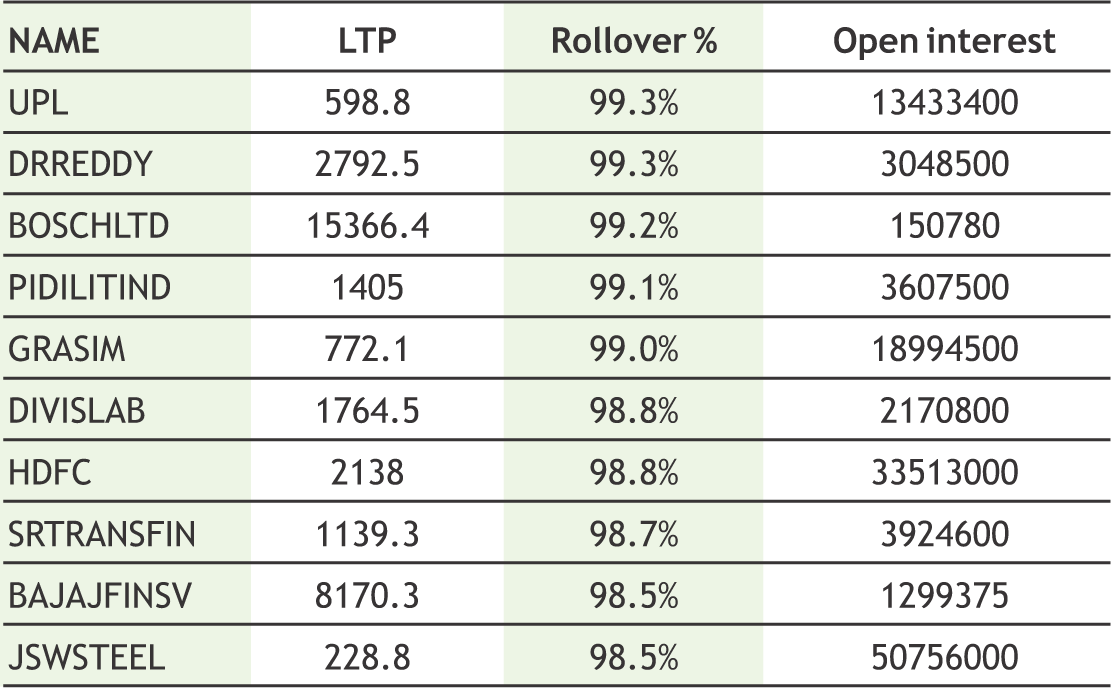
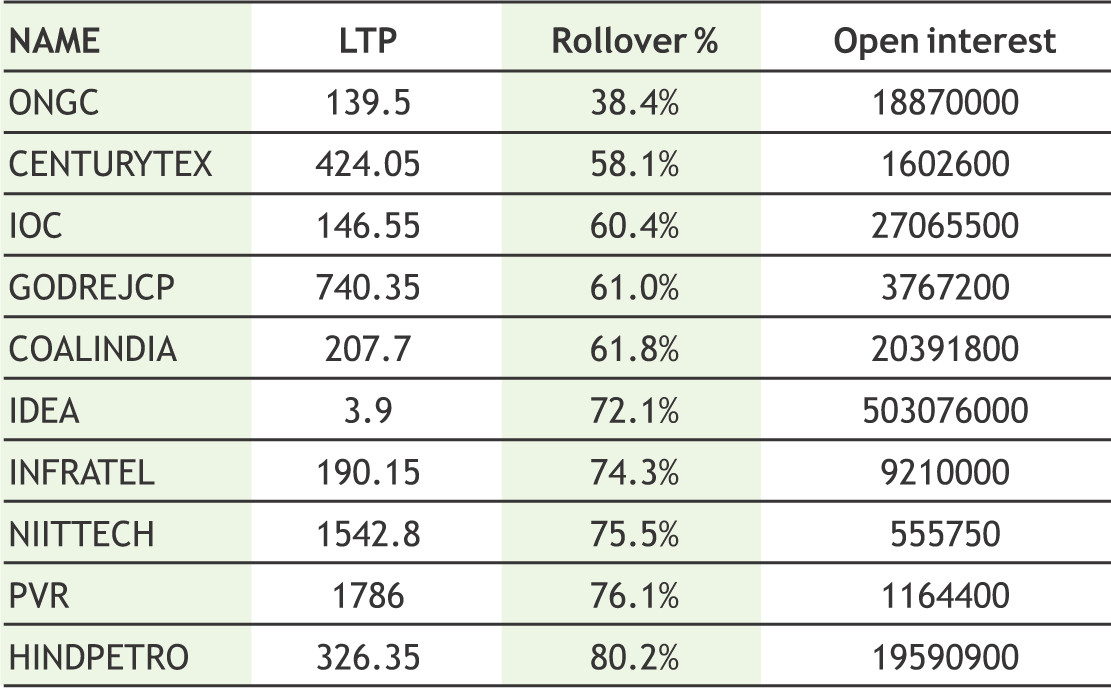
Markets witnessed a strong up-move throughout the week with both Nifty & Bank Nifty indices closing at weekly high levels. Across the board, long positions were added in both the indices with the underlying price adding long positions. Overall derivative data indicates long rollover and most of the Nifty November futures positions has been rolled over in the range of 11800 to 11900. Derivative data indicates bullish scenario to continue. Nifty has multiple supports at lower levels. Various supports are 11700, 11800 spot levels. We will see long buildup and short covering on every dips. In the November option contracts we are seeing maximum options open interest building up in 11800 puts and 12000 calls. In option data we have seen shifting of range towards upper band. Market Undertone is likely to remain bullish. The Implied Volatility (IV) of calls was up and closed at 14.92% while that for put options closed at 14.80%. The Nifty VIX for the week closed at 16.28% and is expected to remain volatile. PCR OI for the week closed at 1.18, which indicates OTM put writing. On the technical front 11750-11800 spot levels is support zone and current trend is likely to continue towards 12000-12100 levels.


8
|
|

|
|
**The highest call open interest acts as resistance and highest put open interest acts as support.
# Price rise with rise in open interest suggests long buildup | Price fall with rise in open interest suggests short buildup
# Price fall with fall in open interest suggests long unwinding | Price rise with fall in open interest suggests short covering

9
Turmeric futures (Nov) may witness gain for the third consecutive week towards 6350 levels. Sales and arrivals of turmeric increased at the markets in Erode district, while prices showing a declining trend. This decrease is due to the arrival of poor quality and also the absence of hybrid or Salem turmeric variety. About 1,500 and odd bags of the spice are arriving and on average 60% sales are being recorded. In news, the task force committee of the Spices Board of India, is likely to recommend the Telangana government to announce minimum support price (MSP) for turmeric crop, by taking the cost of cultivation into consideration. Jeera futures (Nov) is expected to recover to test 16700-16800 levels taking support near 16200 levels. The fundamental factor that will probably push up the counter is the rains in the key growing regions of Gujarat and Rajasthan which is likely to delay sowing by around 10- 15 days. Dhaniya futures (Nov) trend is bullish & is likely to move higher towards 7200 levels. The sentiments are strong due to strong domestic demand and likely delay in sowing of the new crop. Cardamom futures (Nov) is likely to break the support near 2485 & dip to test 2380-2300 levels. Prices of bulk grades of cardamom have started declining at auctions at the Spices Board's e-auction centre at Bodinayakanur. The sentiments are bearish due to expectations of good arrivals in the coming months because of the current spell of rains. At this point of time, majority of the traders are hesitant to buy aggressively and it is leading to a slow procurement.
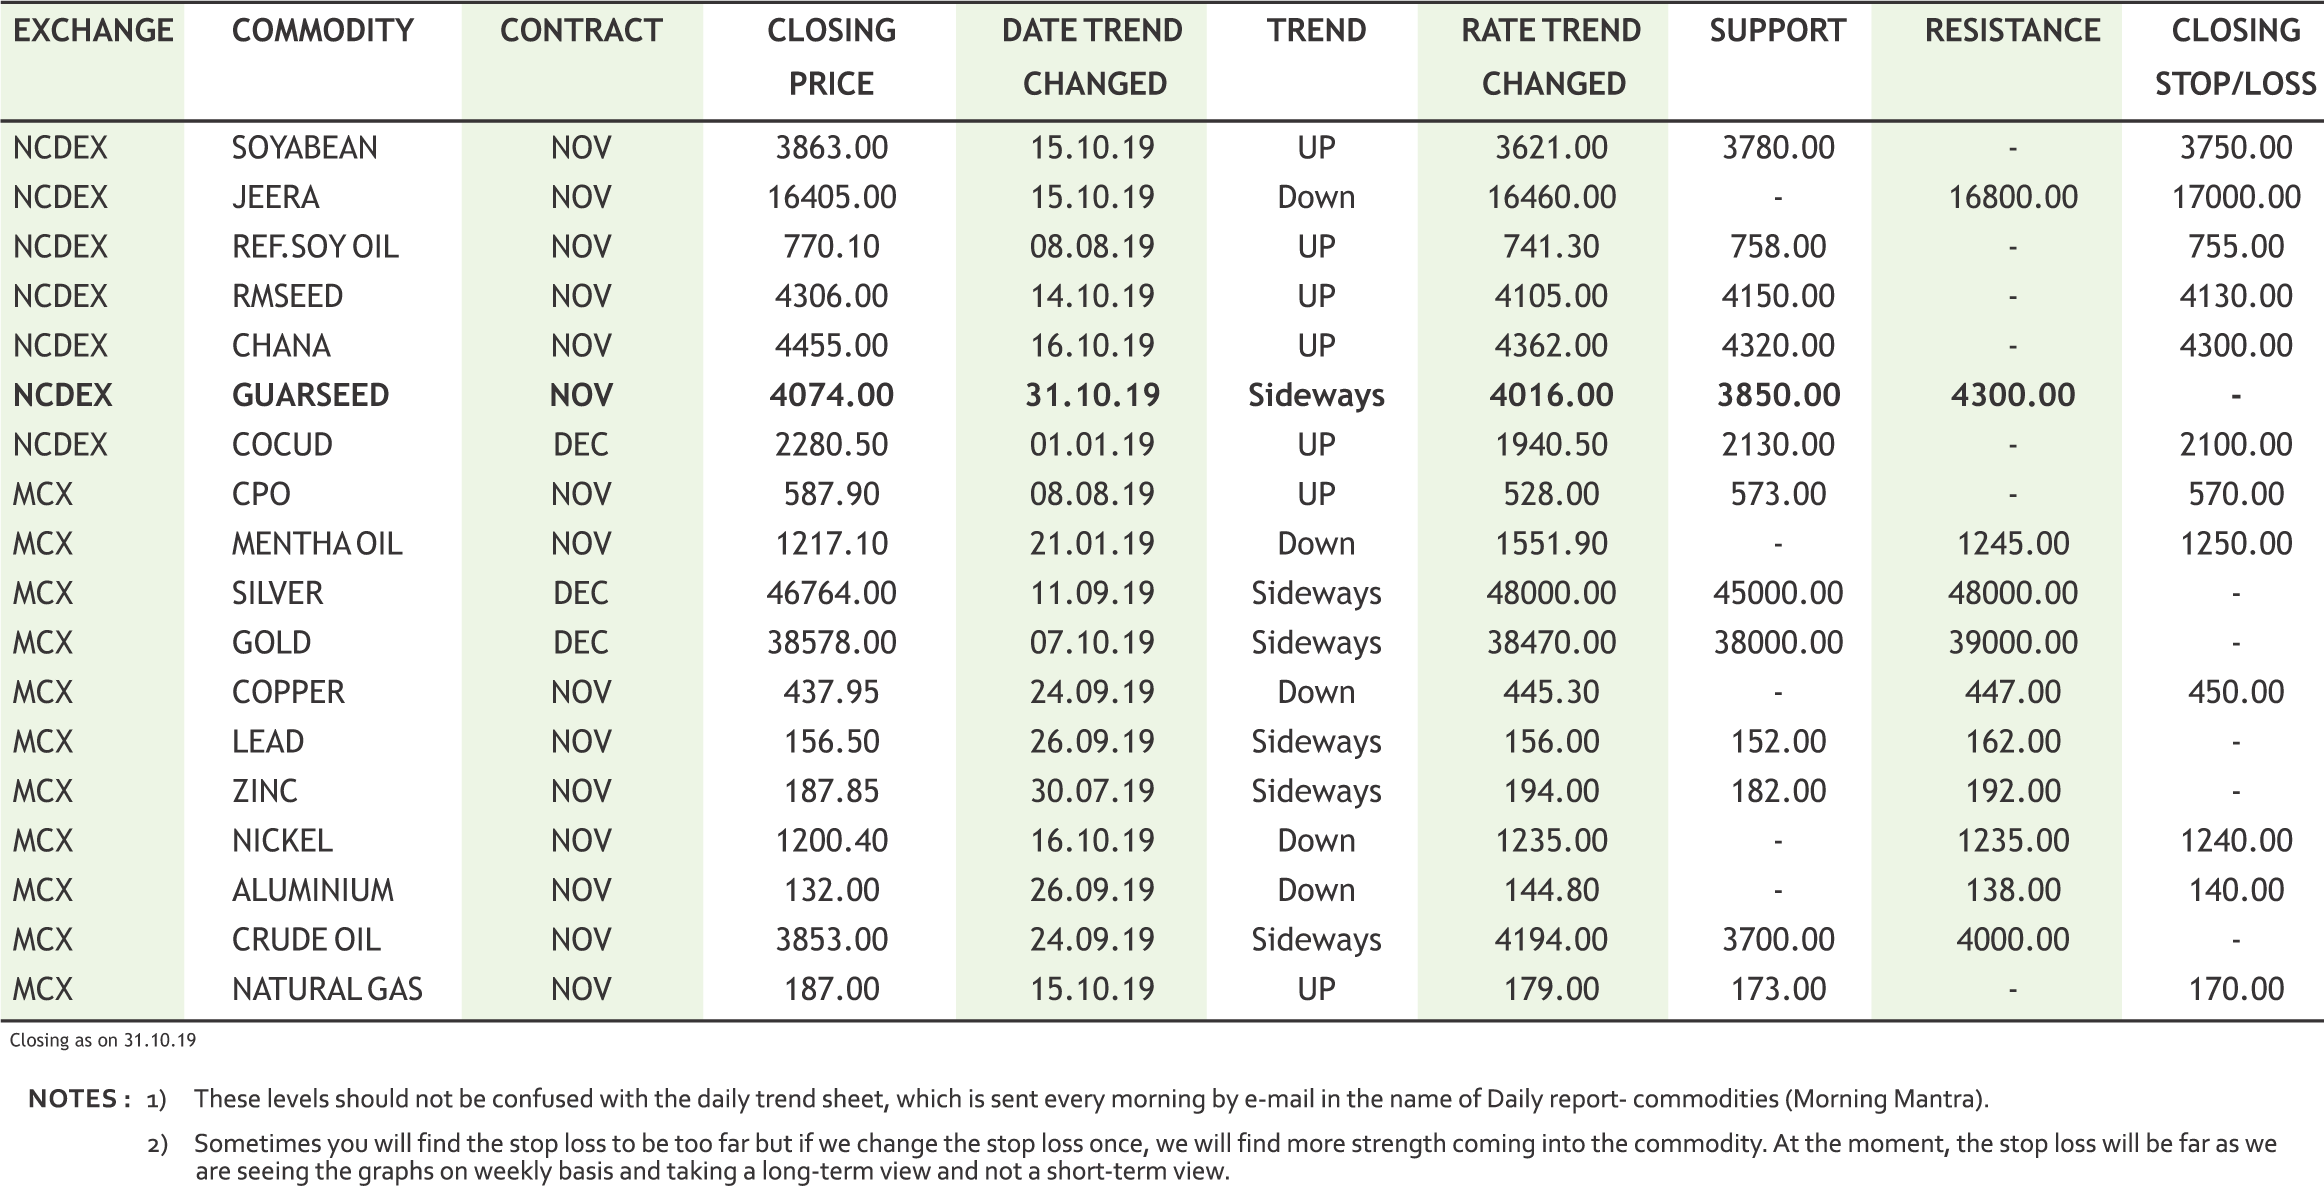
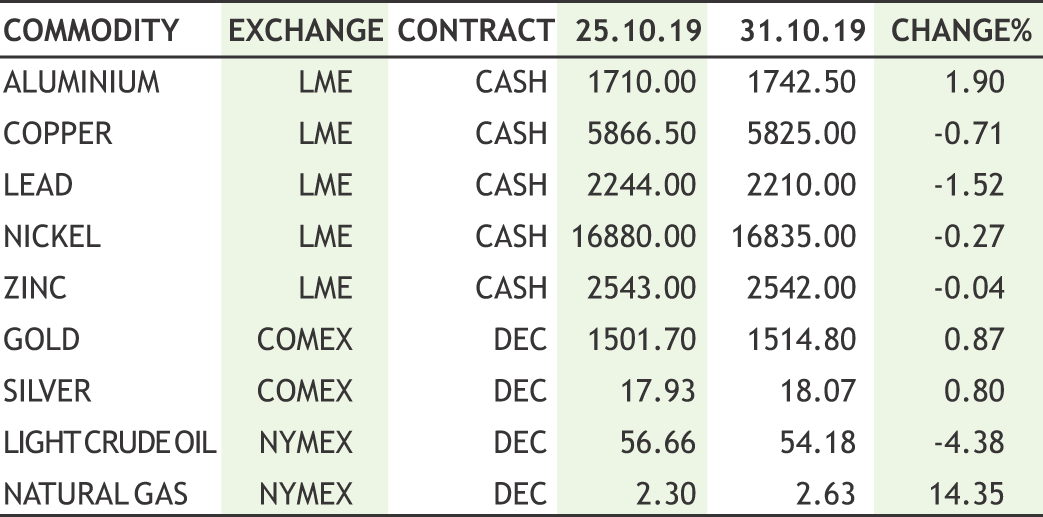
Bullion counter may witness upside momentum as interest rate cut by US Federal Reserve and uncertainty regarding US China trade deal will bolster safe haven appeal. Gold can test 39300 levels while taking support near 38100 levels while silver can test 48000 levels while taking support near 45500 levels. The U.S. central bank cut interest rates by 25bps for the third time this year to help sustain U.S. growth, although signaled that there would be no further reductions unless the economy takes a turn for the worse. In lowering its policy rate by a quarter of a percentage point to a target range of between 1.50% and 1.75%, the U.S. central bank dropped a previous reference in its policy statement that it "will act as appropriate" to sustain the economic expansion - language that was considered a sign for future rate cuts. British parliamentarians approved Prime Minister Boris Johnson’s plan to hold a snap general election on December 12 in a bid to break the Brexit impasse. The International Monetary Fund downgraded its economic forecast for Asia, predicting that the region will grow 0.4 per cent slower than previously anticipated. The trade war with China has been a two-step forward, threestep back affair. The latest reports are coming out of China, whereby Chinese officials expressed doubts about a complete trade deal with the U.S. ever being completed. In September global gold-backed ETFs and similar products had US$4.1bn of net inflows across all regions, increasing their collective gold holdings by 78.6t to 2,855 tonnes(t), the highest levels of all time.
In days to come, we may see more upside momentum in soybean futures (Nov) as it has the potential to test 4000 levels. The sentiments are strong due to rise in demand for the fresh crop from stockists and oil millers. A likely disruption in supply due to continuous rainfall in some parts of Madhya Pradesh may lead to a rise of in soybean price. Southern parts of Madhya Pradesh have been receiving good rain and thunder shower activities for the past few days. Moreover, a confluence zone is also forming over southern parts of Madhya Pradesh where in northerly northeasterly dry winds are merging with humid winds from the Arabian Sea leading to cloud formation and increased rainfall activities. In the benchmark market of Indore, soybean quoted at 3,600-3,650 rupees per 100 kg, firm since past few days. On the CBOT, U.S soybean futures (Nov) may trade sideways to down in the range of $9.05-9.30 a bushel. The upside may remain capped on expectations that weather conditions will turn more favorable for harvesting. Moreover, traders are also monitoring efforts to resolve the U.S.-China trade war, which has slowed shipments of American farm products. The bullish trend of mustard futures (Nov) remains intact & it may rise to test 4400 levels. Traditionally mustard demand remains strong during winter. There is more room for CPO futures (Nov) to move upside to test 595, while soy oil futures (Nov) may continue to witness a rise towards 780-785 levels. This is likely to happen due to overall bullishness in the soybean and upbeat sentiments prevailing in Malaysian palm oil.
Crude oil prices may continue to witness range bound movement as increased global production and uncertainty regarding US China trade deal to prices under pressure while coordinated oil output cut by OPEC to cap the downside. Crude oil may face resistance near 4050 while taking support near 3700 levels. U.S. crude production soared nearly 600,000 barrels per day in August to a record of 12.4 million, buoyed by a 30% increase in Gulf of Mexico output, becoming the world's largest oil producer. OPEC oil output has bounced in October from an eight-year low as a rapid recovery in Saudi Arabian production from attacks on oil plants more than offset losses in Ecuador and voluntary curbs under a supply pact. OPEC has pumped 29.59 million bpd this month, up 690,000 from September's revised figure which was the lowest monthly total since 2011. Saudi Arabia has pumped 9.90 million bpd, up 850,0000 bpd from September. The OPEC and other producers including Russia, a grouping referred to as OPEC+ - have cut oil output by 1.2 million barrels per day to support prices since January. Natural gas may witness further upside momentum as the weather is expected to be much colder than normal especially in the mid-west for the next 6-10 and 8-14 days driving up heating demand. There is one tropical disturbance in the lower Atlantic that NOAA projects 10% chance of turning into a tropical cyclone over the next 48-hours. Hedge funds are still short futures and options position which could continue to drive short covering. Natural gas may test 200 levels while taking support near 172 levels.
Kapas futures (Apr) may continue to find support near 1075 levels & trade on a steady note. Cotton prices are firm to steady at major markets in Central and South India amid concerns over crop damage and on mills demand. There are reports of crop loss in the Marathwada region of Maharashtra and also in Andhra Pradesh. In major growing areas, the fibre was in the last stage of picking & the rains caused massive loss to the farmers as the quality of kapas would be reduced. This phenomenon of weather has reduced the pace of harvest & arrivals also. Total new crop arrivals so far this season has reached 1,548,000 bales, down 46.36% from 2,886,000 bales arrived during the same period last year. In the international market, ICE cotton futures (Dec) is likely to face resistance near 66 cents per pound & trade with a downside bias. Factors such as weak export sales and uncertainty over a trade deal between the United States and China is taking a toll over the counter since past two consecutive weeks. Chana futures (Nov) is expected to face resistance near 4555 levels & we may see major upside in days to come due to sluggish miller’s trade activity as demand and sale counters in processed besan are slow. Mentha oil futures (Oct) may gain towards 1240, taking support near 1190. Lower level buying from the pharma industries for medicinal purpose ahead of winter season & plunging stocks at the MCX-accredited warehouses since past four consecutive weeks may act as catalyst to the upside momentum.
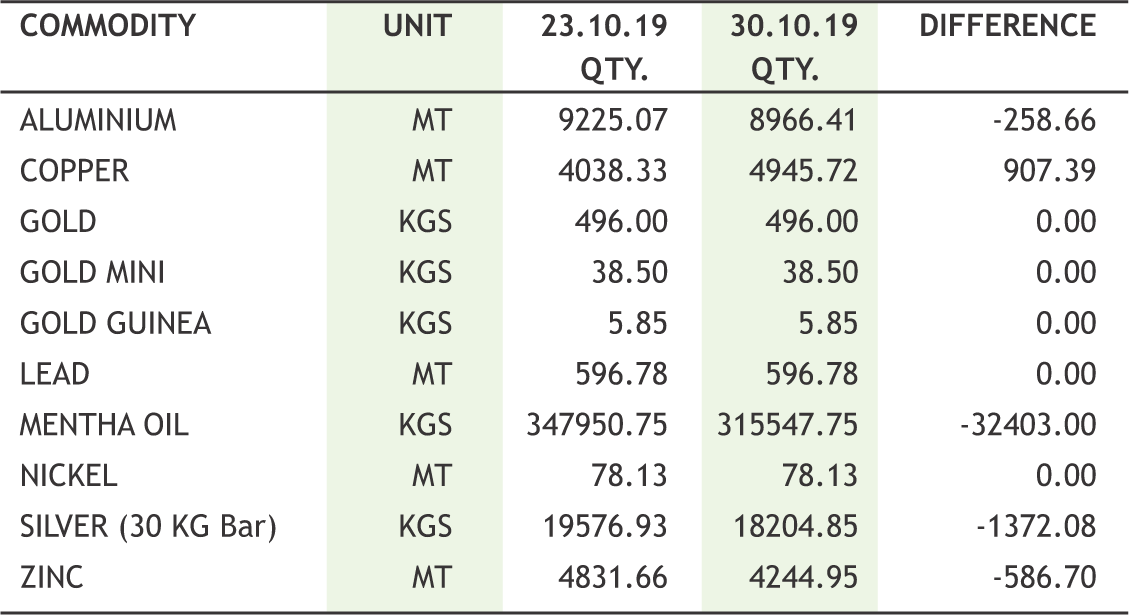
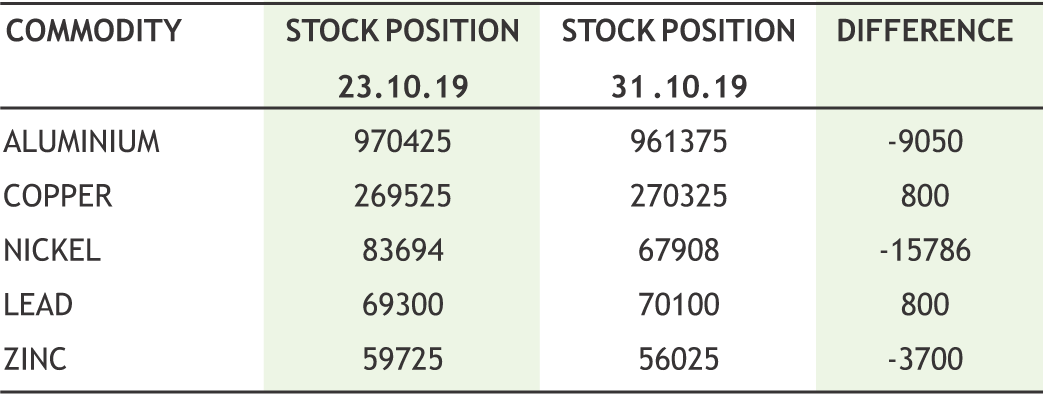
Base metal counter may witness range bound movement .Factory activity in China shrank for the 6th straight month in October, pointing to further pressure on its manufacturers as they grapple with the weakest economic growth in nearly 30 years. Copper may trade sideways as it can face resistance near 450 levels and support near 435. Stocks of copper in LME-registered warehouses rose by 19,575 tonnes to 270,325 tonnes. Inventories have nearly doubled since the start of the year, suggesting that supply is adequate. The roughly 25 million tonne a year copper market should have a deficit of 320,000 tonnes this year and a surplus of 281,000 tonnes in 2020, ICSG. Meanwhile, Lead may also remain sideways as it can move range of 150-160 levels. Zinc may witness lower level buying as it can test 200 levels while taking support near 182 levels. Zinc inventories in London Metal Exchange-registered warehouses are at 57,775 tonnes. They fell to 50,425 tonnes in April, the lowest since the 1990s. Nickel prices can move with sideways bias as it can face resistance near 1240 while taking support near 1170. Nickel miner Independence Group NL stated that it will stop work on developing a downstream nickel sulphate facility after winning improved terms in two recent off-take agreements for concentrate from its Nova mine. Indonesia could resume nickel ore exports in one to two weeks once an investigation into violations of export rules completes. Aluminium can trade with sideways to weak bias as it can test 127 levels while facing resistance near 138 levels.

10
|
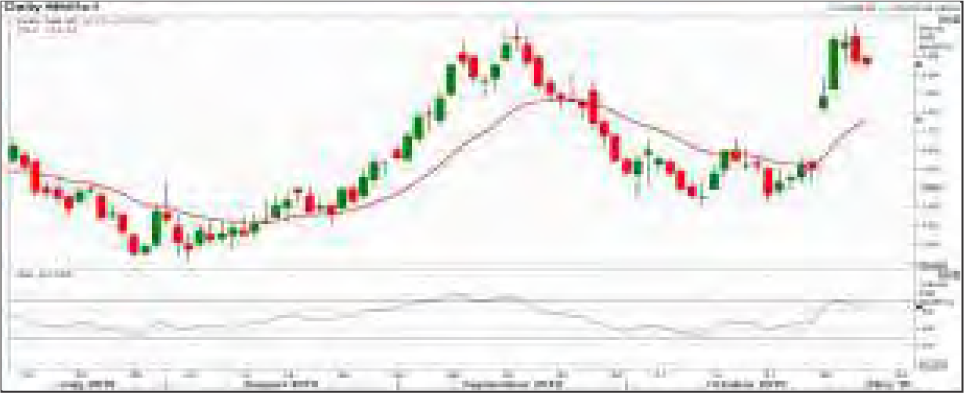
NATURAL GAS MCX (NOV) contract closed at Rs. 187.00 on 31st Oct’19. The contract made its high of Rs. 209.80 on 17th Sep’19 and a low of Rs. 171.30 on 11th Oct’19. . The 18-day Exponential Moving Average of the commodity is currently at Rs. 182.36. On the daily chart, the commodity has Relative Strength Index (14-day) value of 56.436.
One can buy between Rs. 179-182 for a target of Rs. 210 with the stop loss of Rs. 170.
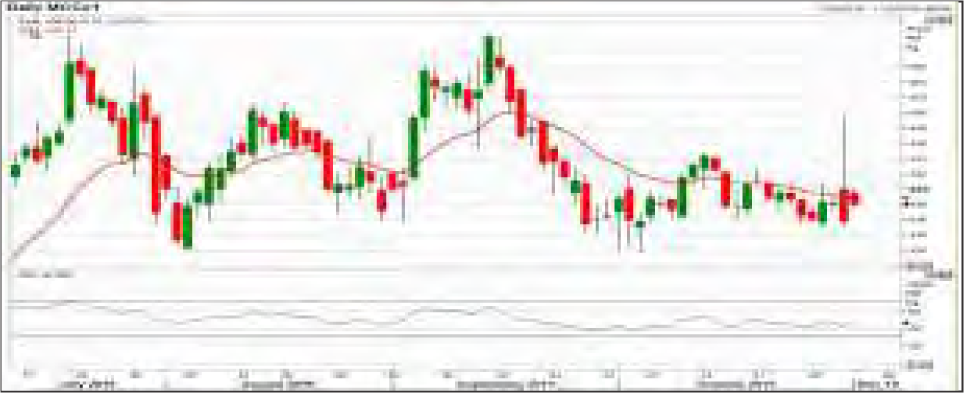
COPPER MCX (NOV) contract closed at Rs. 437.95 on 31st Oct’19. The contract made its high of Rs. 460.95 on 16th Sep’19 and a low of Rs. 435.90 on 10th Oct’19. The 18-day Exponential Moving Average of the commodity is currently at Rs. 443.17. On the daily chart, the commodity has Relative Strength Index (14-day) value of 37.096.
One can sell near Rs. 445 for a target of Rs. 430 with the stop loss of Rs. 450.
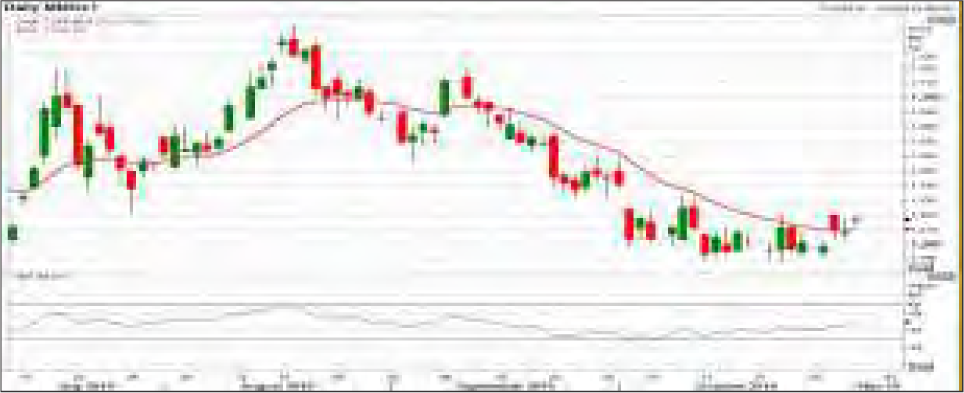
MENTHAOIL MCX (NOV) contract was closed at Rs. 1210.00 on 31st Oct’19. The contract made its high of Rs. 1297.00 on 19th Sep’19 and a low of Rs. 1200.40 on 14th Oct’19. The 18-day Exponential Moving Average of the commodity is currently at Rs. 1222.12. On the daily chart, the commodity has Relative Strength Index (14-day) value of 41.305.
One can buy above Rs. 1225 for a target of Rs. 1280 with the stop loss of Rs 1198.

11
• Total farm exports during April-September, at $ 17.29 billion, stood 9.1% lower than the $ 19.02 billion for the same period of 2018-19.
• Deutsche Bank has received the Securities and Exchange Board of India's permission to launch custodial services in four derivatives contracts such as gold, crude oil, natural gas and index futures, making it the first custodian in the commodity derivatives segment.
• India's 2019-20 daily cotton arrivals down 68.3% Y/Y at 46,500 bales on Oct 31st.
• US cotton net export Sales for Oct 18-24 down 23% weekon-week at 108,100 RB, while US soybean net export sales for Oct 18-24 up 99% week-on-week at 943,600 MT.
• China's three biggest commodities exchanges said they would end their practice of double-counting trades from Jan. 1, 2020 and report on a single-count basis instead to help them converge with international standards.
• The Dalian Commodity Exchange (DCE) aims to launch iron ore options, soda ash, coffee and peanuts futures among others trading this year.
• Chile’s manufacturing production dropped 1.5% in September, compared with the same month the previous year amid a 5.4% decrease in mining production.
• Chile’s manufacturing production dropped 1.5% in September, compared with the same month the previous year amid a 5.4% decrease in mining production.
• China's nickel ore imports in September rose 24.6% from the previous month to their highest since at least 2016.
• Glencore Plc reported a 3.8% drop in quarterly copper output as it prepared to shut its Mutanda operation in the Democratic Republic of Congo.
In the week gone by, CRB index continued its upside trend on positive movements in bullions and Natural gas. Bullion counter surged higher last week as Fed’s reduced interest rate by quarter basis point and Governor Powell stated that economy is expected to grow at a moderate rate and the monetary policy is in a good place although Fed will not be thinking about rate hikes for now unless there is a dramatic change in inflation. Gold took support near 37800 and recovered towards 38600 while silver took support near 45600 and recovered towards 46800. One more snag in the US China phase one trade deal, as Chile’s president cancelled the APEC summit which was scheduled this month where both US and Chinese leaders were set to meet and discuss further on the trade deal. Chinese factory activity shrank for the sixth straight month in October. US- China trade war discussion meets a new hurdle when the summit in Chile where they were supposed to meet was cancelled because of violent protests. Copper dipped lower and tested 440 on uncertainty regarding US trade deal. Nickel also traded with sideways path. On-warrant nickel stocks in LME-registered warehouses have plunged to 30,300 tonnes from more than 110,000 tonnes in August, the lowest since 2007. Chile's manufacturing production dropped 1.5% in September, compared with the same month the previous year amid a 5.4% decrease in mining production. While Natural gas moved higher in the week and scaled higher above key level of 192 on the back of forecasts for colder-than-normal temperatures across the central U.S. Crude oil traded sideways to lower path as Crude stocks at the Cushing, Oklahoma rose for a fourth straight week, gaining 1.6 Mbpd. Still, gasoline and distillate inventories extended their declines where Gasoline fell by 3Mbpd and Distillate decline by 1Mbpd, the fifth weekly drop by product stock gave some support to prices even as refiners ramped up production.
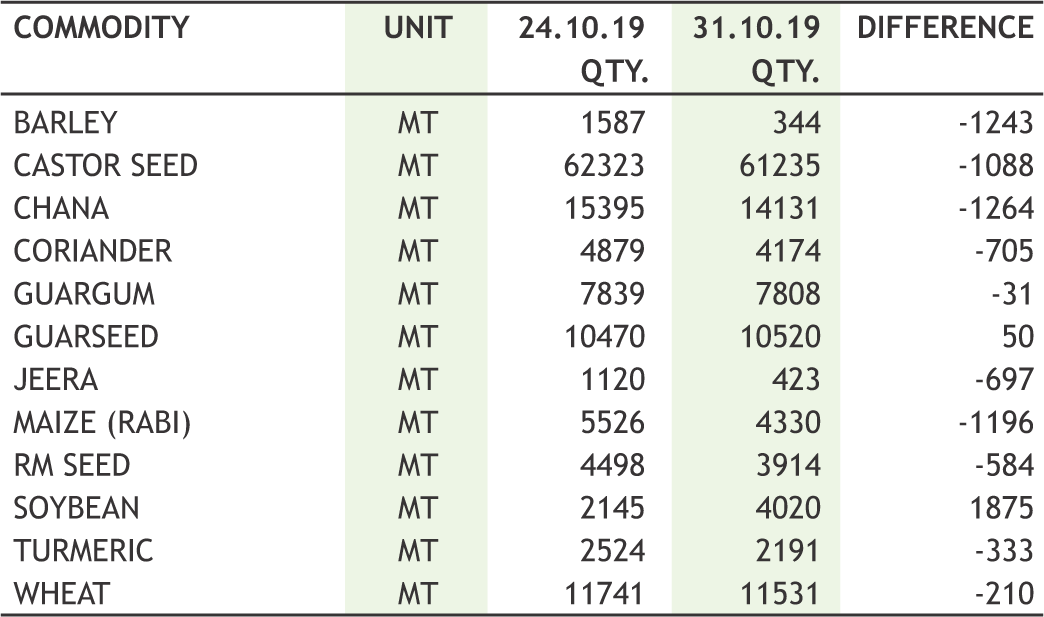
Last week, most of the agri commodities posted gains on account of unseasonal rainfall delaying the sowing of Rabi crop such as mustard, chickpea, dhaniya & jeera. The harvesting as well as arrivals of Kharif crops are also getting slowed down for Kharif crops majorly soybean & cotton. During the week (24 to 30 October), rainfall was above Long Period Average (LPA) by 200% over the country as a whole, whereas as a whole, cumulative rainfall during this year’s post- monsoon season (1st- 30 October, 2019) is above LPA by 42%. Exception was cardamom, which continued to plunge on account of higher arrivals & slowdown in demand as the festivities are on the verge of an end.

|

|

12

|
|
Gold is the ultimate hard currency. Gold is a ‘must have’ financial asset indeed. Not only investors, but also nation’s central banks try to hoard gold in times of crisis as gold is playing a new role in the changing international financial environment.
Central banks across the world are aggressively adding gold to their foreign exchange (forex) reserves. According to data from the World Gold Council (WGC), the net gold purchases by central banks was 651.5 tons in 2018, the highest level of annual net central bank gold purchases since the suspension of dollar convertibility into gold in 1971. Notably, the central-banks buying have also become geographically more diverse as several new countries adding gold for the first time in decades.
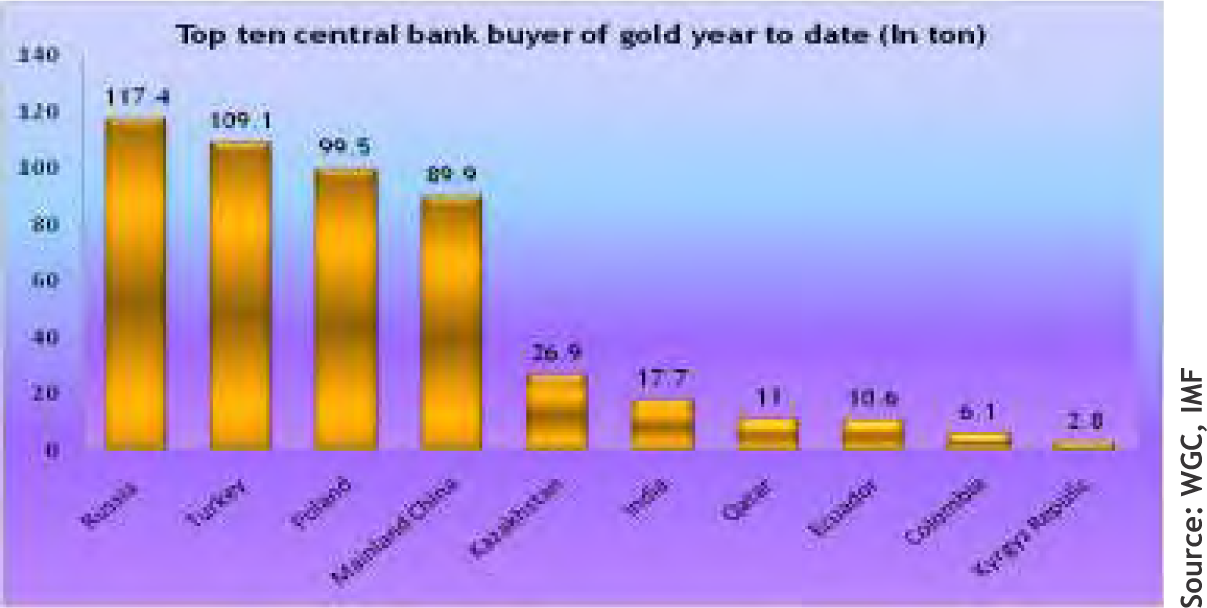
In 2019, the big players have been Russia, Turkey, and Poland
• According to the World Gold Council, a dozen central banks increased their gold holdings by at least one ton through the first eight months of 2019.
• Russia and China have been the leading buyers despite of significant gold producers. Russia added another 11.3 tons to its hoard in August and increased its gold holdings by 117.4 tons this year alone. The Russian Central Bank's gold reserves topped $100 billion in September.
• China bought another 5.9 tons in August, the ninth straight month of gold purchases for the People's Bank of China and increased its gold holdings by nearly 90 tons this year.
• The January to June period saw the highest levels of central bank purchases since 2010. Poland was the top buyer, with reserves growing 77 percent to 100 tonnes.
• Qatar increased its gold reserves by 11 tons in 2019.
• In August, two central banks sold gold amounts greater than one ton. Kazakhstan shrunk reserves by 2.6 tons. This was a reverse in course. The Kazakh central bank has been aggressively buying gold.
• Uzbekistan sold another 2.2 tons of gold in August after dumping 22.4 tons in July.
Why Central-Bank Gold Buying Picked Up
• Gold is a 100 percent guarantee from legal and geopolitical risks. Preserving its historical value, gold continues to be one of the safest assets in the world.
• The gold enhances the long-term stability of countries reserves and strengthens market confidence even under normal market circumstances.
• A report from the Dutch central bank “If the entire system collapses, the gold stock provides collateral to start over. Gold gives confidence in the power of the central bank’s balance sheet. That gives a safe feeling.”
• Considering the uncertainty like volatility or a correction in the stock market as well as dollar, central bankers are adding gold to their reserves as a hedge as they don’t want to be caught unawares like they were in 2008
• Some Countries want to reduce the amount of U.S. dollar from its forex reserve portfolio and just looking for ways to diversify of reserves as they desire to move from dollar dependent global financial system to multi-polar reserve system. In the case of Russia, officials simply want to move away from the U.S. dollar.


13

|
| 29th OCT | UK set for general election on 12th December after MP’s vote. |
| 30th OCT | FED cuts rates, but signals pause in easing cycle. |
| 31st OCT | Trump says US-China trade deal is close. |
| 31st OCT | China doubts long-term trade deal possible with Trump. |
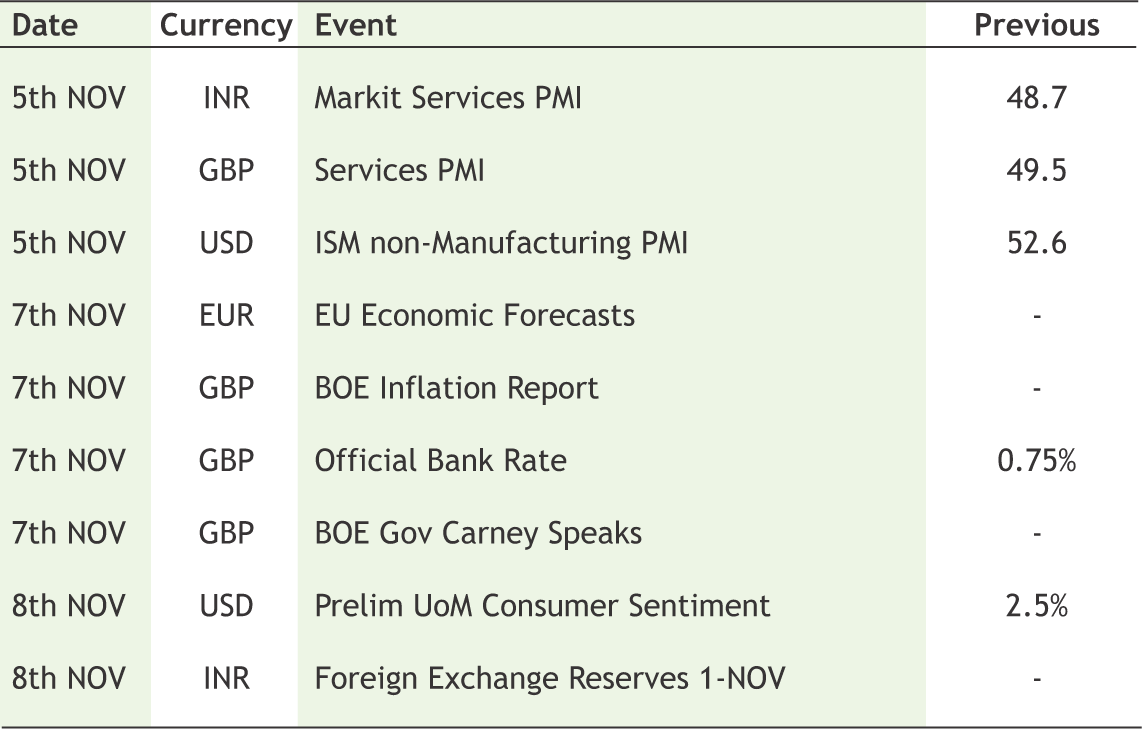
Indian Rupee drifted a modest recovery this week amid improved sentiment in FIIs flows into Indian debt and equity markets. Flows to the tune more than 8000 cores landed in October paring the outflows trend recorded in August and September. Meanwhile global equities hit record high this week after widely expected easing by 25 bps in Fed Fund rate from Federal Reserve delivered by Jay Powell delivered for the third time since July. Further Jay Powell said that “uncertainty on the economic outlook justified the latest cut, although preliminary US-China trade deal and lower risk of a no-deal Brexit had the potential to increase business confidence”. What’s more Powell hinted for a pause in further reduction in rates till any major abrupt changes hit in economic releases. In the wake of such comments, dollar reacted positively but later retreated as markets are sensing a thin validation of Powell comments. However, riskier assets re-treated a bit after sudden change in sentiment came in US-China trade amid new questions over a long-term trade deal between the worlds’ two key economies. Bloomberg reported Chinese officials have warned they will not move on their key priorities in the trade dispute, and added they are concerned over President Donald Trump’s decision making. From Brexit front, UK is headed for another general election on December 12 followed by possible exit on 31st January. Next week leading indicators from Euro Zone and monetary policy from Bank of England will give further volatility in major pairs. USDINR is likely to stay within the range of 70.65 and 71.30 in the next week.
|
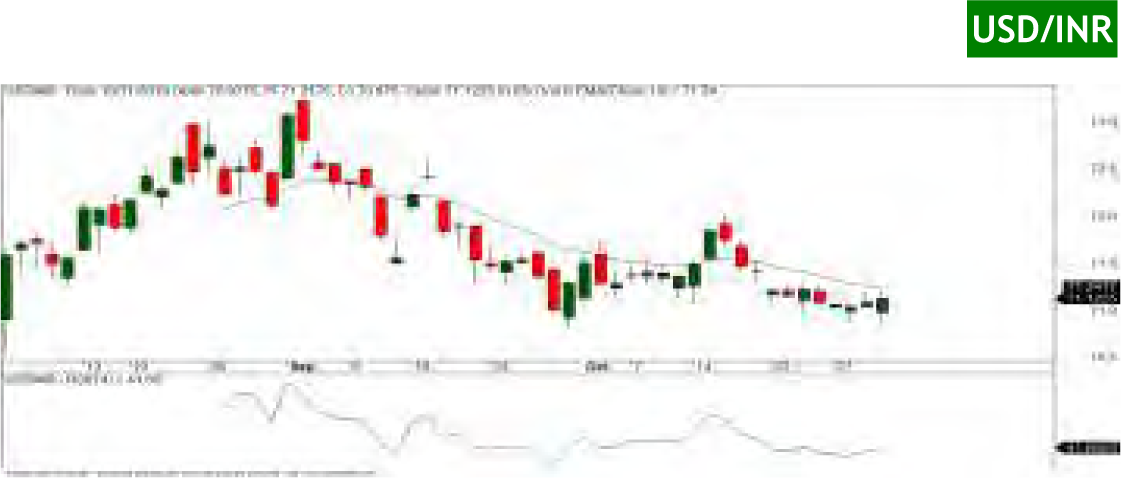
USD/INR (NOV) contract closed at 71.1225 on 31st Oct’19. The contract made its high of 71.2175 on 31st Oct’19 and a low of 70.86 on 29th Oct’19 (Weekly Basis). The 14-day Exponential Moving Average of the USD/INR is currently at 71.24.
On the daily chart, the USD/INR has Relative Strength Index (14-day) value of 41.66. One can buy above 71.30 for the target of 71.90 with the stop loss of 71.

EUR/INR (NOV) contract closed at 79.5425 on 31st Oct’19. The contract made its high of 79.72 on 31st Oct’19 and a low of 78.72 on 29th Oct’19 (Weekly Basis). The 14-day Exponential Moving Average of the EUR/INR is currently at 79.18.
On the daily chart, EUR/INR has Relative Strength Index (14-day) value of 55.33. One can sell at 79.60 for a target of 79 with the stop loss of 79.90.

GBP/INR (NOV) contract closed at 92.1450 on 31st Oct’19. The contract made its high of 92.22 on 31st Oct’19 and a low of 90.9825 on 29th Oct’19 (Weekly Basis). The 14-day Exponential Moving Average of the GBP/INR is currently at 91.10.
On the daily chart, GBP/INR has Relative Strength Index (14-day) value of 65.37. One can buy at 91.50 for a target of 92.10 with the stop loss of 91.20.
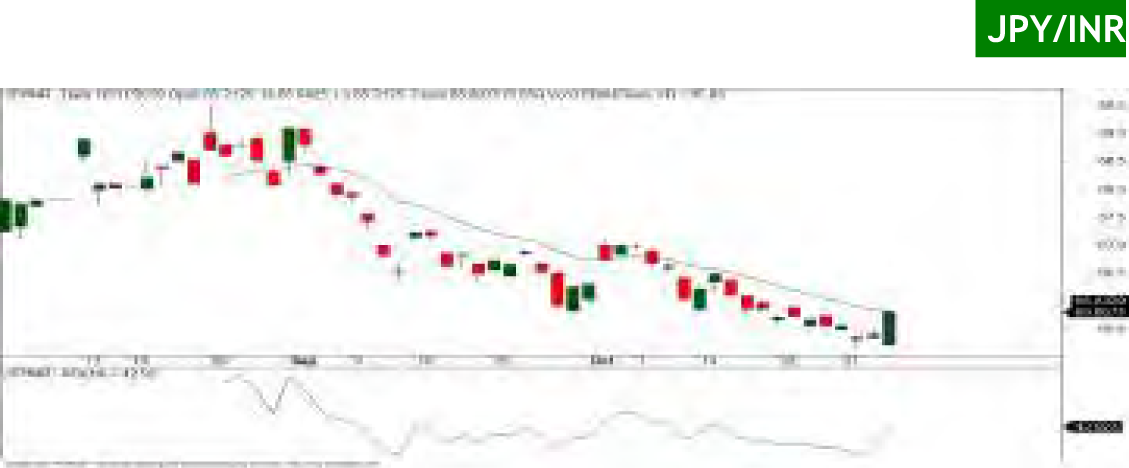
JPY/INR (NOV) contract closed at 65.8075 on 31st Oct’19. The contract made its high of 65.8425 on 31st Oct’19 and a low of 65.1250 on 29th Oct’19 (Weekly Basis). The 14-day Exponential Moving Average of the JPY/INR is currently at 65.83.
On the daily chart, JPY/INR has Relative Strength Index (14-day) value of 42.92. One can buy above 65.95 for a target of 66.55 with the stop loss of 65.65.

14
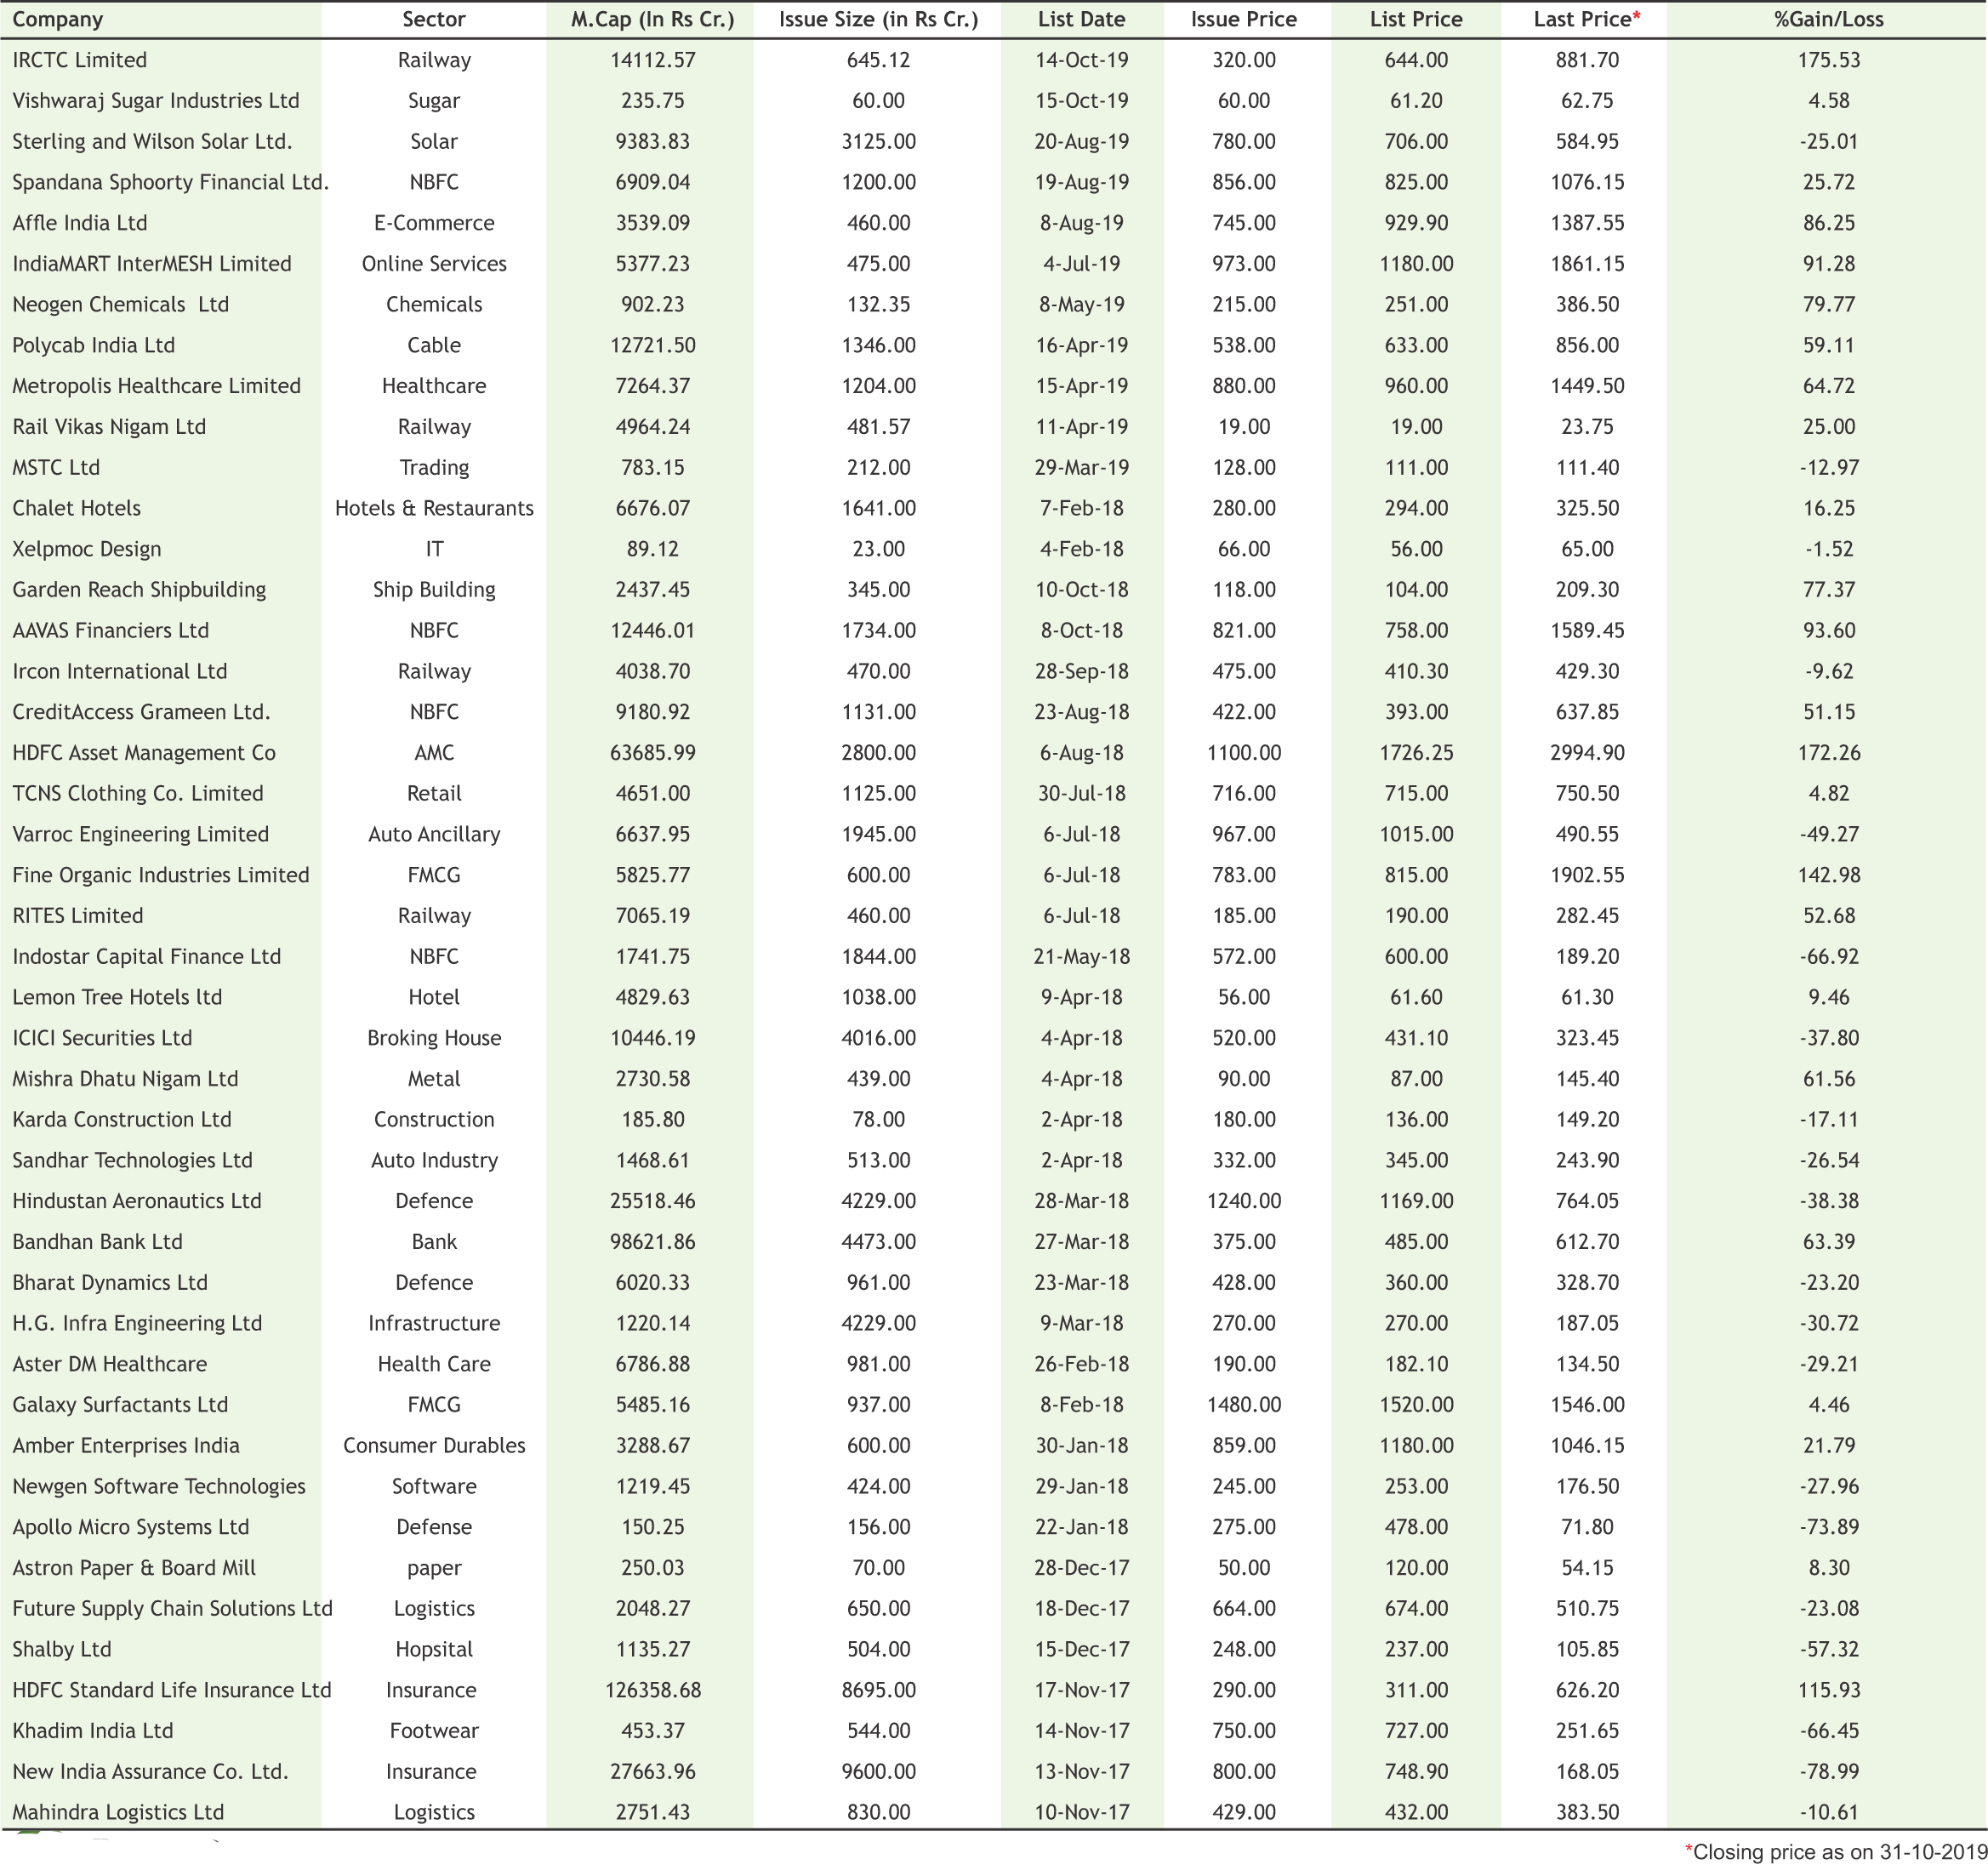
Ujjivan Small Finance Bank has received markets regulator Sebi's go ahead to raise Rs 1,200 crore through an initial public offer (IPO). Microfinance lender Ujjivan Financial Services is the holding company of Ujjivan Small Finance Bank. The bank, which had filed draft papers with the regulator in August, obtained its observations on October 16, according to the Securities and Exchange Board of India (Sebi). As per the draft papers, the bank is proposing to undertake an initial public offering of equity shares of face value of Rs 10 each, comprising a fresh issue of shares aggregating up to Rs 12,000 crore. The proposed issue includes reservation of equity shares aggregating up to around Rs 120 crore for subscription by eligible shareholders of Ujjivan Financial. The proceeds of the issue will be utilised towards augmenting the company's capital base to meet future requirements. Ujjivan Financial Services had raised Rs 300 crore in February from a clutch of investors, including HDFC Life and Sundaram MF, in a pre-IPO placement. The funding valued the company at around Rs 2,000 crore. After the IPO, Ujjivan Small Finance Bank will join listed peers like AU Small Finance Bank.
|

15
|
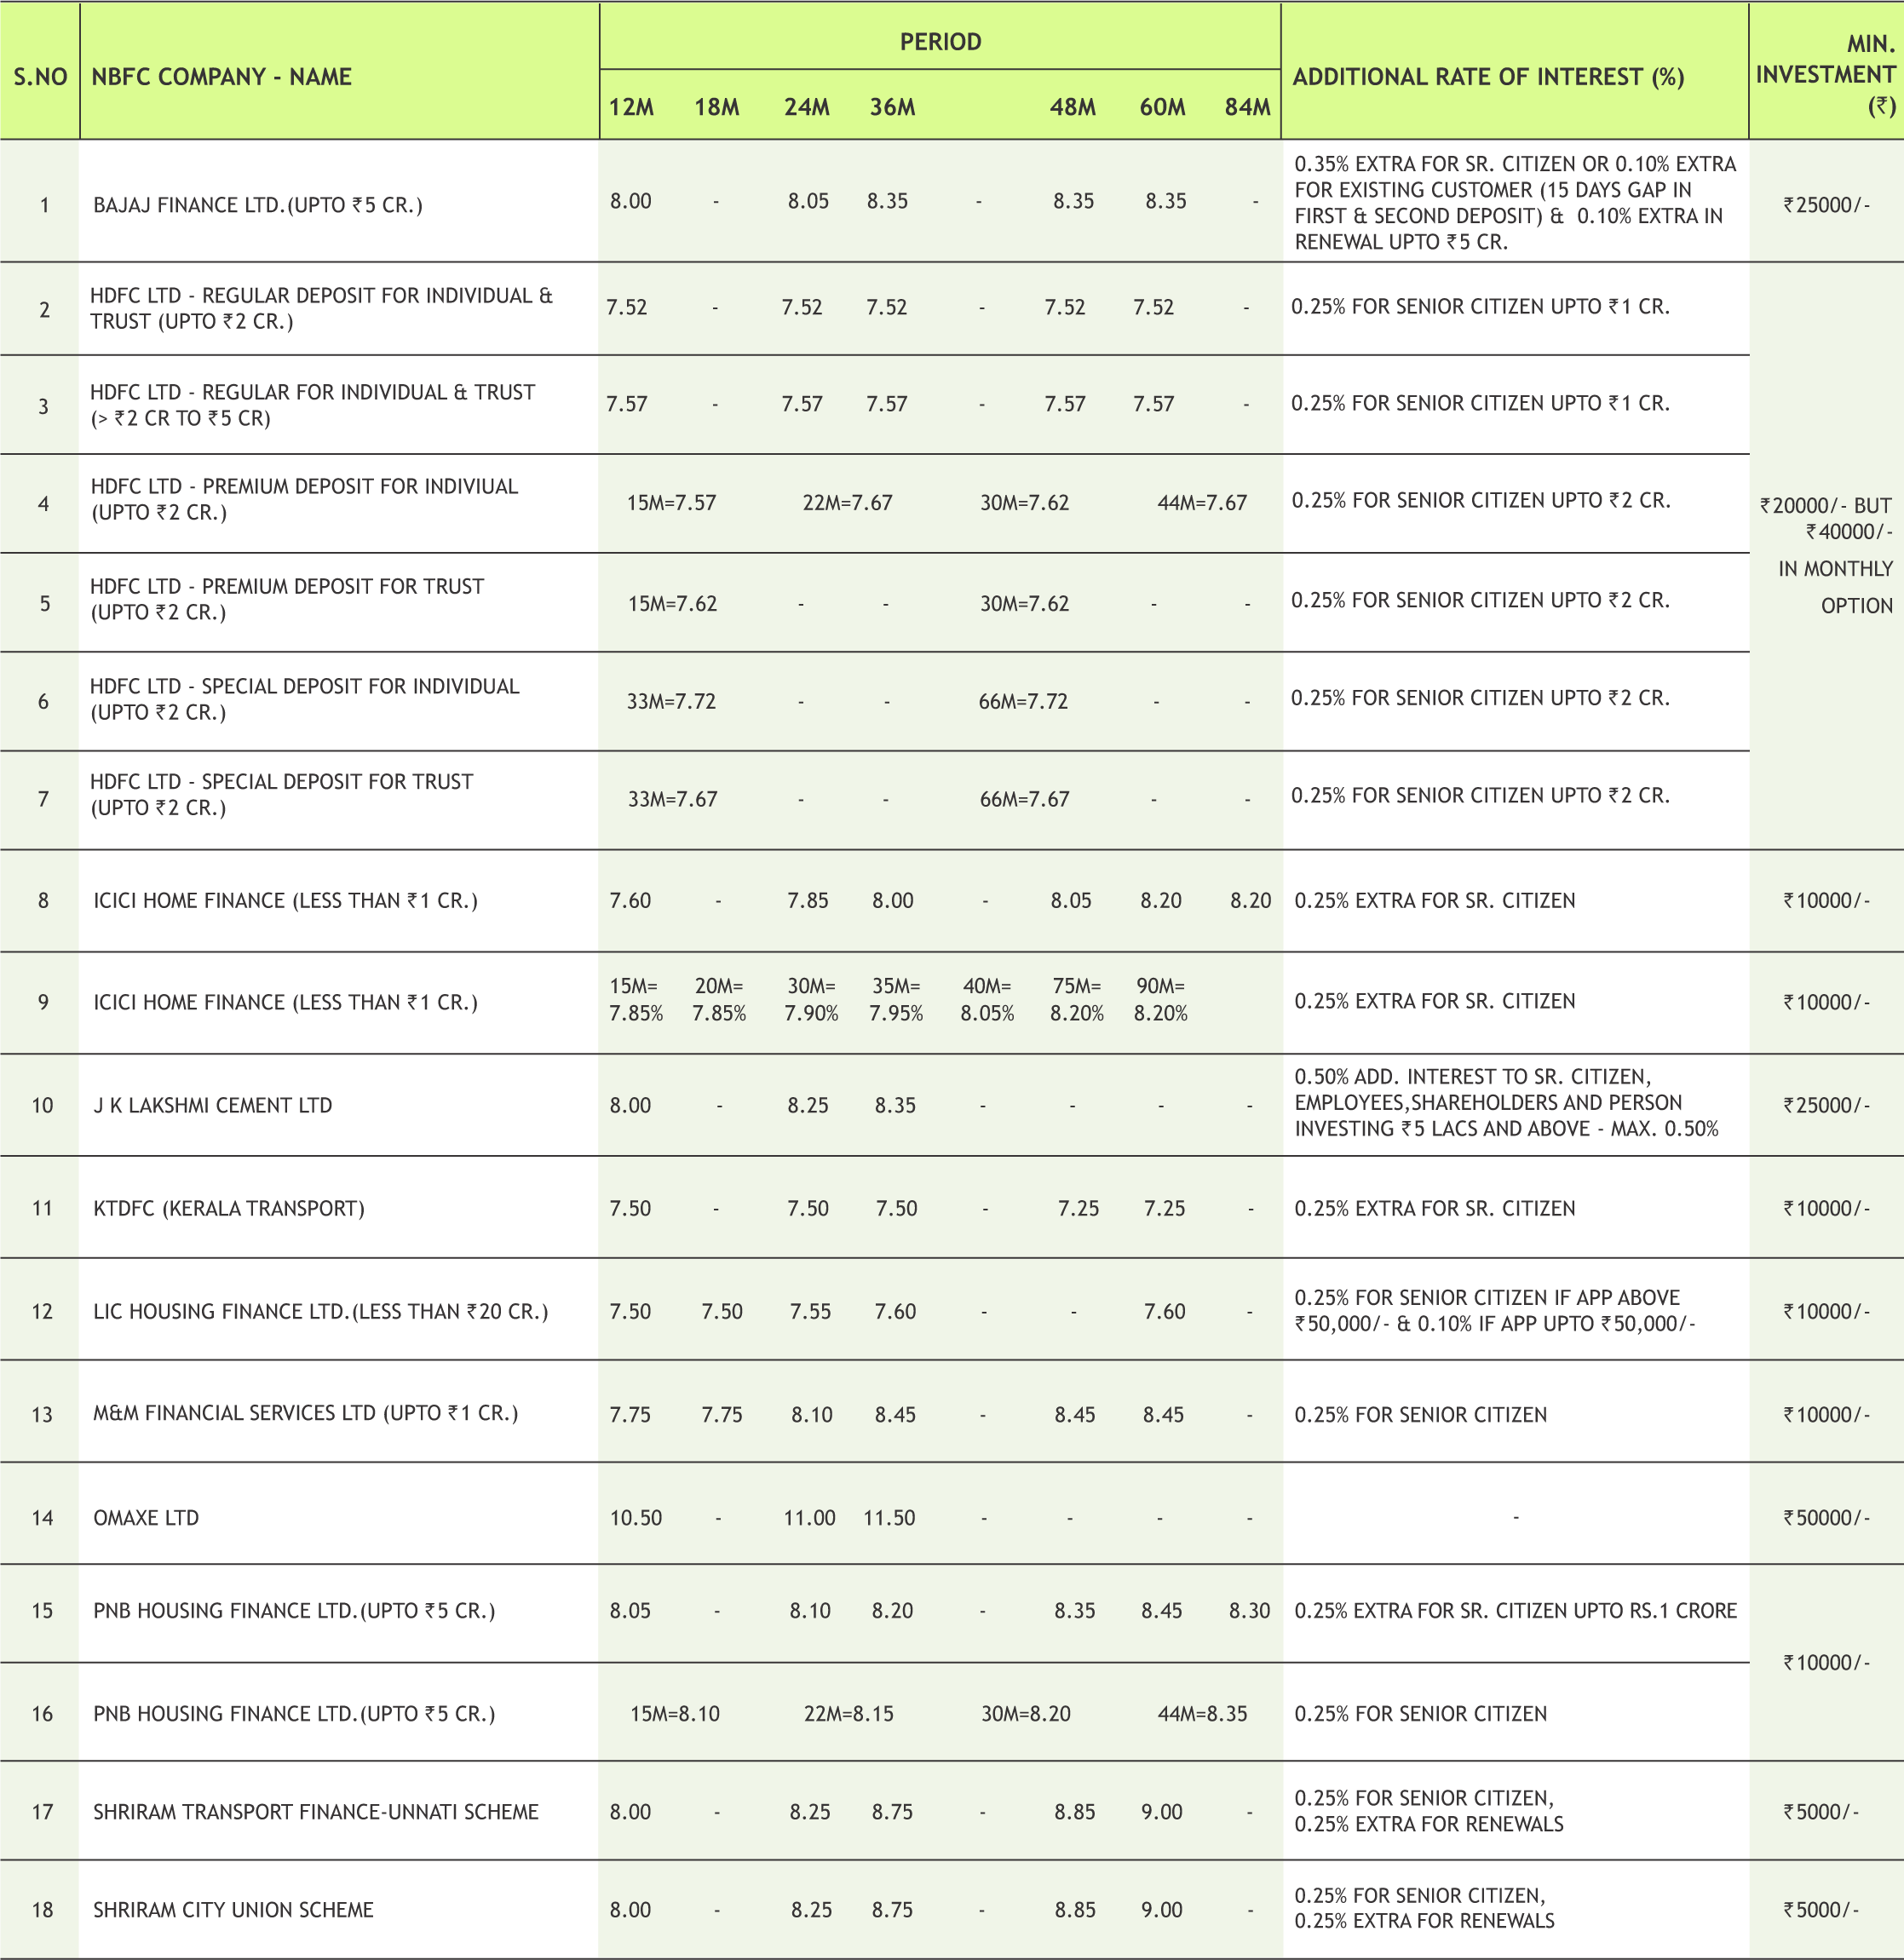
* Interest Rate may be revised by company from time to time. Please confirm Interest rates before submitting the application.
* For Application of Rs.50 Lac & above, Contact to Head Office.
* Email us at fd@smcindiaonline.com


16
Mutual funds add around 3.45 lakh folios in September, total tally at 8.56 crore
The mutual fund industry has added 3.45 lakh investor accounts in September, taking the total tally to 8.56 crore, amid volatile market conditions. In comparison, the industry had added 4.8 lakh new folios in August and more than 10 lakh folios in July. Folios are numbers designated to individual investor accounts. An investor can have multiple folios. According to data from Association of Mutual Funds in India, the number of folios with 44 fund houses rose to 8,56,26,244 at the end of September, from 8,52,81,222 at the end of August, registering a gain of 3.45 lakh folios. The total folio count stood at 8.48 lakh in July, 8.38 lakh in June, 8.32 lakh in May and 8.27 lakh in April.
Mutual Funds wrap: SEBI's rollout of graded exit load on liquid funds — A system reforming step
SEBI has allowed fund houses to impose an exit load of 0.007 percent on investors if they redeem their investment within a day. The load reduces to 0.0065 percent on day two; 0.006 percent on day three, 0.0055 percent on day four; 0.005 percent on day five; 0.0045 percent on day six and 0 percent from the seventh day onwards.
REITs, InvITs gain traction; mutual funds invest Rs 9,000cr during January-September
Emerging investment instruments -- REITs and InvITs --seem to be finally catching on with investors as mutual funds have invested nearly Rs 9,000 crore in such units in the first nine months of the year. Fund managers have infused Rs 451 crore in real estate investment trusts (REITs) and Rs 8,528 crore in infrastructure investment trusts (InvITs), according to the Securities and Exchange Board of India (SEBI). Mutual funds have increased their exposure in these investment avenues over the past nine months. The investment by fund houses in REITs jumped to a staggering Rs 69 crore in September from a mere Rs 7 crore in January, while the same in InvITs rose to Rs 1,034 crore in September from Rs 611 crore in January.
The equity AUM has decreased marginally to Rs 7.58 lakh crore in September end from Rs 7.56 lakh crore in May.
In the last six months, the equity AUM (assets under management) has decreased marginally to Rs 7.58 lakh crore in September end from Rs 7.56 lakh crore in May. As of September end, the average asset under the management of the 44-player mutual fund industry stood at Rs 25.60 lakh crore. Of this, equity contributes nearly 30 percent which is 7.56 lakh crore.
Mahindra MF to rope in Canara Robeco MF’s Krishna Sanghavi as CIO from Nov 1
Industry veteran Krishna Sanghavi will be joining Mahindra Mutual Fund as the Chief Investment Officer with effect from November 1, two sources told Moneycontrol. Sanghavi, who had joined Canara Robeco Mutual Fund as Head of Equities in September 2018, quit the fund house last month. Prior to joining Canara Robeco MF, he was also associated with AVIVA Life Insurance and Kotak Mahindra Group. He has more than two decades of experience in the financial services sector in the fields of dealer finance, credit appraisal and credit risk management, business planning and fund management. He holds a BCom, ICWA and MMS (Finance) as his educational qualifications. He is a CFA (Chartered Financial Analyst) from ICFAI and a Cost and Works Accountant from ICWAI.

17

|

|

|

|

|
Note:Indicative corpus are including Growth & Dividend option . The above mentioned data is on the basis of 08/08/2019 Beta, Sharpe and Standard Deviation are calculated on the basis of period: 1 year, frequency: Weekly Friday, RF: 7%
*Mutual Fund investments are subject to market risks, read all scheme related documents carefully

18
Some Joyful glimpse of Diwali Celebration at SMC Head Office & Branches Pan India.


![]() Customized Plans
Customized Plans
![]() Comprehensive Investment Solutions
Comprehensive Investment Solutions
![]() Long-term Focus
Long-term Focus
![]() Independent & Objective Advise
Independent & Objective Advise
![]() Financial Planning
Financial Planning
Call Toll-Free 180011 0909
Visit www.smcindiaonline.com
REGISTERED OFFICES:
11 / 6B, Shanti Chamber, Pusa Road, New Delhi 110005. Tel: 91-11-30111000, Fax: 91-11-25754365
MUMBAI OFFICE:
Lotus Corporate Park, A Wing 401 / 402 , 4th Floor , Graham Firth Steel Compound, Off Western Express Highway, Jay Coach Signal, Goreagon (East) Mumbai - 400063
Tel: 91-22-67341600, Fax: 91-22-67341697
KOLKATA OFFICE:
18, Rabindra Sarani, Poddar Court, Gate No-4,5th Floor, Kolkata-700001 Tel.: 033 6612 7000/033 4058 7000, Fax: 033 6612 7004/033 4058 7004
AHMEDABAD OFFICE :
10/A, 4th Floor, Kalapurnam Building, Near Municipal Market, C G Road, Ahmedabad-380009, Gujarat
Tel : 91-79-26424801 - 05, 40049801 - 03
CHENNAI OFFICE:
Salzburg Square, Flat No.1, III rd Floor, Door No.107, Harrington Road, Chetpet, Chennai - 600031.
Tel: 044-39109100, Fax -044- 39109111
SECUNDERABAD OFFICE:
315, 4th Floor Above CMR Exclusive, BhuvanaTower, S D Road, Secunderabad, Telangana-500003
Tel : 040-30031007/8/9
DUBAI OFFICE:
2404, 1 Lake Plaza Tower, Cluster T, Jumeriah Lake Towers, PO Box 117210, Dubai, UAE
Tel: 97145139780 Fax : 97145139781
Email ID : pankaj@smccomex.com
smcdmcc@gmail.com
Printed and Published on behalf of
Mr. Saurabh Jain @ Publication Address
11/6B, Shanti Chamber, Pusa Road, New Delhi-110005
Website: www.smcindiaonline.com
Investor Grievance : igc@smcindiaonline.com
Printed at: S&S MARKETING
102, Mahavirji Complex LSC-3, Rishabh Vihar, New Delhi - 110092 (India) Ph.: +91-11- 43035012, 43035014, Email: ss@sandsmarketing.in