2019: Issue 666, Week: 14th – 18th January

A Weekly Update from SMC (For private circulation only)


WISE MNEY

www.smcfinance.com

FOCUS ON YOUR BUSINESS,NOT FINANCE

Get easy business loans with SMC Finance

At SMC Finance, We make it easy for you to get a loan. Whether you are expanding your business, upgrading new equipments or for working capital. We are here to help you grow fast.

Professional and Transparent approach

Quick loan approval & disbursal

Hassle-free documentation process

Attractive Rate of Interest

Call Toll-Free 1800118818

E-mail nbfccare@smcfinance.com


Medical Equipment Finance | Personal Loan | Loan Against Property | Loan Against Shares/Mutual Funds/Bonds | MSME/SME Financing | Lease Rental Discounting | Promoter Financing | Debtors Financing | Structured Financing | Affordable Housing Application Financing | IPO/ NCD Financing | Business Loan

Moneywise Financial Services Pvt. Ltd. (A wholly owned subsidiary of SMC Global Securities Ltd.) Corporate Office: 11/6-B, 2nd Floor, Pusa Road, New Delhi 110005, Tel. +91-11-30111000, CIN No.: U51909WB1996PTC078352


SMC GROUP PRESENCE:

  • DELHI
  • |
  • MUMBAI
  • |
  • KOLKATA
  • |
  • AHEMDABAD
  • |
  • LUCKNOW
  • |
  • CHANDIGARH
  • |
  • DUBAI

Contents


From The Desk Of Editor

I

n the week gone by, global equities rallied on signs of progress between U.S. and China I and dovish comments from Federal Reserve signalling to interest rate hike on hold in the scheduled March meeting. Euro-area economy looks to be on weak footing in 2019 and as per reports, manufacturing and services activity is weakest since 2014. Central bank of China is expected to support its economy through further cut in Reserve Ratio Requirement in 2019 to boost its slowing economy. China’s factory inflation slowed down for the sixth consecutive month in December reflecting soft demand lower commodity prices. World Bank in its semi-annual “global economic prospects” report said that global economic growth would slow to 2.9 per cent this year from a downwardly revised 3 per cent in 2018. The report says that worries over trade war, weak global growth and financial stress in the developing economies are likely to weigh on global growth outlook however it expects India to remain the fastest growing emerging market economy.

Back at home, domestic market ended the last trading day of the week on negative note. On the macro front, the GST council took major decisions to give relief to Micro, Small and Medium Enterprises (MSME) (including small traders) among others. The council increased turnover limit for the existing composition scheme. The limit of annual turnover in the preceding financial year for availing composition scheme for goods shall be increased to Rs 1.5 crore. Expectations of expensive bailout for farmers before general elections together with sharp rebound in oil prices took its toll on the domestic Rupee that showed weak performance compared to other currencies in Asia. Recently, CSO released the first advance estimates of GDP for 2018-19, which showed the Indian economy is likely to grow at 7.2% in the current fiscal ending 31 March. Going forward, market will closely watch the third quarter results, macroeconomic data, trend in global markets, investment by foreign portfolio investors (FPIs) and domestic institutional investors (DIIs), the movement of rupee against the dollar and crude oil price movement.

On the commodity market front, commodity market witnessed good moves and CRB jumped above 185. Earlier CRB has made a low of 174.22 levels on correction. Bullion counter upside momentum is likely to continue further as dovish statement from Fed Chairman, Jerome Powell confirmed slow in the rate hike in 2019 and this may restrict the gains for the Dollar Index. Gold can again test the level of 32500 taking support near 31700 while silver can move further northwards and can test 40100 levels. Crude oil prices are expected to remain on buoyant path and can test 3900 in MCX. In base metal counter, prices can extend its recovery on growing optimism regarding US and China trade deal. CPI of UK, Bank of England Credit Conditions & Bank Liabilities Surveys, CPI of Japan and Canada, Retail Sales Advance and University of Michigan. Sentiment of US etc are some data and events scheduled this week.


(Saurabh Jain)


SMC Global Securities Ltd. (hereinafter referred to as “SMC”) is a registered Member of National Stock Exchange of India Limited, Bombay Stock Exchange Limited and its associate is member of MCX stock Exchange Limited. It is also registered as a Depository Participant with CDSL and NSDL. Its associates merchant banker and Portfolio Manager are registered with SEBI and NBFC registered with RBI. It also has registration with AMFI as a Mutual Fund Distributor.

SMC is a SEBI registered Research Analyst having registration number INH100001849. SMC or its associates has not been debarred/ suspended by SEBI or any other regulatory authority for accessing /dealing in securities market.

SMC or its associates including its relatives/analyst do not hold any financial interest/beneficial ownership of more than 1% in the company covered by Analyst. SMC or its associates and relatives does not have any material conflict of interest. SMC or its associates/analyst has not received any compensation from the company covered by Analyst during the past twelve months. The subject company has not been a client of SMC during the past twelve months. SMC or its associates has not received any compensation or other benefits from the company covered by analyst or third party in connection with the research report. The Analyst has not served as an officer, director or employee of company covered by Analyst and SMC has not been engaged in market making activity of the company covered by Analyst.

The views expressed are based solely on information available publicly available/internal data/ other reliable sources believed to be true.

SMC does not represent/ provide any warranty express or implied to the accuracy, contents or views expressed herein and investors are advised to independently evaluate the market conditions/risks involved before making any investment decision.

EQUITY


NEWS

DOMESTIC NEWS

Economy

• In a major relief to micro, small and medium enterprises (MSMEs), the GST Council doubled the tax exemption limit to Rs 40 lakh in annual revenue. The turnover limit for businesses availing of the GST composition scheme, which allows them to pay goods and services tax at a flat rate, was raised to Rs 1.5 crore.

Power

• NTPC Limited has planned to invest almost Rs 10,300 crore in Greenfield power plants in Uttar Pradesh. These plants include a proposed 1,600 megawatt (Mw) (2x800) thermal power project at Shaktinagar (Singrauli) in Sonebhadra district of UP. This project is estimated to entail investment of Rs 9,000 crore

Oil & Gas

• ONGC will pump in Rs 6,000 crore in drilling 200 wells over the next seven years in Assam in order to increase the output from the state.

Automobile

• Ashok Leyland has bagged orders from IRT (Institute of Road Transport) Chennai, UPSRTC (Uttar Pradesh State Roadways Transport Corporation) and CTU (Chandigarh Transport Undertaking) for manufacturing a total of 2,580 buses. The orders are among the largest from state transport undertakings (STU’s) for a single OEM and are likely to be delivered before March 2019.

FMCG

• ITC has entered into an arrangement with the Bamboo Research and Training Centre (BRTC) in Maharashtra for the supply of agarbattis (incense sticks) marketed under its Mangaldeep brand. This is part of ITC’s safety matches and agarbatti business unit.

Pharmaceuticals

• Zydus Cadila has received final approval from the US health regulator to market antipsychotic drug. Aripiprazole tablets in the strengths of 2 mg, 5 mg, 10 mg, 15 mg, 20 mg, and 30 mg. Aripiprazole, an antipsychotic drug (atypical type), is used to treat mental/mood disorders such as bipolar disorder, schizophrenia, Tourette's disorder, and irritability associated with autistic disorder.

Infrastructure

• Adani group will invest Rs 70,000 crore over the next 20 years to build solar powered data centre parks of up to 5 gigawatts in and around Visakhapatnam in Andhra Pradesh, its single largest investment till date. In a move that would bolster India’s technology infrastructure and boost the concept of green data centres, the group signed a memorandum of understanding with the Andhra Pradesh government.

INTERNATIONAL NEWS

• U.S. initial jobless claims fell to 216,000, a decrease of 17,000 from the previous week's revised level of 233,000. Economists had expected jobless claims to dip to 225,000 from the 231.000 originally reported for the previous week.

• Eurozone unemployment rate unexpectedly eased in November to its lowest level in over a decade. The seasonally adjusted jobless rate eased to 7.9 percent from a revised 8 percent in October. Economists had expected the rate to remain unchanged at October's original rate of 8.1 percent.

• Japan has a current account surplus of 757.2 billion yen in November. That exceeded expectations for a surplus of 566.3 billion yen and was down from 1,309.9 billion yen in October.The trade balance reflected a deficit of 559.1 billion yen versus expectations for a shortfall of 612.6 billion yen following the 321.7 billion yen deficit in the previous month.

• Japan Overall Bank Lending was up 2.4% on year in December, coming in at 534.545 trillion yen the Bank of Japan said. That follows the 2.1 percent increase in November excluding trusts, bank lending climbed an annual 2.5 percent to 465.227 trillion yen - up from 2.2 percent in the previous month.

• Japan Household Spending Climbs 0.3% in November - coming in at 281,041 yen. The average of monthly income per household was 455,644 yen - up 1.8 percent on year and also up a discontinuity-adjusted 0.1 percent.

• Consumer prices in China were up just 1.9 percent on year in December. That was shy of expectations for an increase of 2.1 percent on year and down from 2.2 percent in November.


TREND SHEET


Stocks *Closing Price Trend Date Trend Changed Rate Trend Changed SUPPORT RESISTANCE Closing S/l
S&P BSE SENSEX* 36010 DOWN 05.10.18 34970 - 36500
NIFTY50** 10795 DOWN 05.10.18 10316 - 11000
NIFTY IT 14307 UP 21.07.17 10712 13600 13400
NIFTY BANK 27454 UP 30.11.18 26863 25900 25400
ACC 1457 UP 16.11.18 1501 1450 1430
BHARTIAIRTEL 335 DOWN 25.01.18 453 340 350
BPCL*** 337 UP 16.11.18 322 - 330
CIPLA 510 DOWN 26.10.18 604 550 560
SBIN 303 UP 02.11.18 286 270 260
HINDALCO 206 DOWN 04.01.19 211 225 230
ICICI BANK 379 UP 02.11.18 355 350 340
INFOSYS 684 UP 14.12.18 706 660 640
ITC 295 UP 11.01.19 295 280 275
L&T 1370 UP 02.11.18 1358 1358 1320
MARUTI 7321 DOWN 14.09.18 8627 7600 7800
NTPC 148 DOWN 26.10.18 159 152 155
ONGC 145 DOWN 05.10.18 147 155 158
RELIANCE**** 1098 UP 30.11.18 1168 - 1070
TATASTEEL 474 DOWN 26.10.18 552 510 520

*SENSEX has breached the resistance of 35700
**NIFTY has breached the resistance of 10700
***BPCL has broken the support of 345
***RELIANCE has broken the support of 1100

Closing as on 11-01-2019

NOTES:

1) These levels should not be confused with the daily trend sheet, which is sent every morning by e-mail in the name of "Morning Mantra ".

2) Sometimes you will find the stop loss to be too far but if we change the stop loss once, we will find more strength coming into the stock. At the moment, the stop loss will be far as we are seeing the graphs on weekly basis and taking a long-term view and not a short-term view.


FORTHCOMING EVENTS


Meeting Date Company Purpose
15/01/2019 KPIT Tech. Quarterly Results
15/01/2019 Multi Comm. Exc. Quarterly Results
15/01/2019 Zee Entertainmen Quarterly Results
16/01/2019 DCB Bank Quarterly Results
16/01/2019 Mindtree Quarterly Results,Interim Dividend
17/01/2019 Federal Bank Quarterly Results
17/01/2019 Hind. Unilever Quarterly Results
18/01/2019 NIIT Tech. Quarterly Results
18/01/2019 Wipro Quarterly Results,Interim Dividend
19/01/2019 HDFC Bank Quarterly Results
21/01/2019 KotakMah. Bank Quarterly Results
22/01/2019 Asian Paints Quarterly Results
22/01/2019 Havells India Quarterly Results
22/01/2019 ICICI Pru Life Quarterly Results
22/01/2019 Shree Cement Quarterly Results,Interim Dividend
22/01/2019 TVS Motor Co. Quarterly Results
23/01/2019 ITC Quarterly Results
23/01/2019 PidiliteInds. Quarterly Results
24/01/2019 Biocon Quarterly Results
24/01/2019 Colgate-Palm. Quarterly Results
24/01/2019 24/01/2019 Quarterly Results
24/01/2019 Yes Bank Quarterly Results
25/01/2019 DewanHsg. Fin. Quarterly Results
25/01/2019 M & M Fin. Serv. Quarterly Results
Ex-Date Company Purpose
15/01/2019 Gujarat Gas FV Split (Sub-Division) - From Rs 10/- To Rs 2/- Per Share
17/01/2019 NMDC Buy Back
17/01/2019 Tata Consultancy Services s Interim Dividend
23/01/2019 MindTree Interim Dividend

4

EQUITY


5

EQUITY


Beat the street - Fundamental Analysis


SUPREME INDUSTRIES LIMITED

CMP: 1074.85

Target Price: 1242

Upside:16%

VALUE PARAMETERS

Face Value (Rs.) 2.00
52 Week High/Low 1489.95/935.85
M.Cap (Rs. in Cr.) 13653.48
EPS (Rs.) 38.50
P/E Ratio (times) 27.92
P/B Ratio (times) 6.82
Dividend Yield (%) 1.34
Stock Exchange BSE

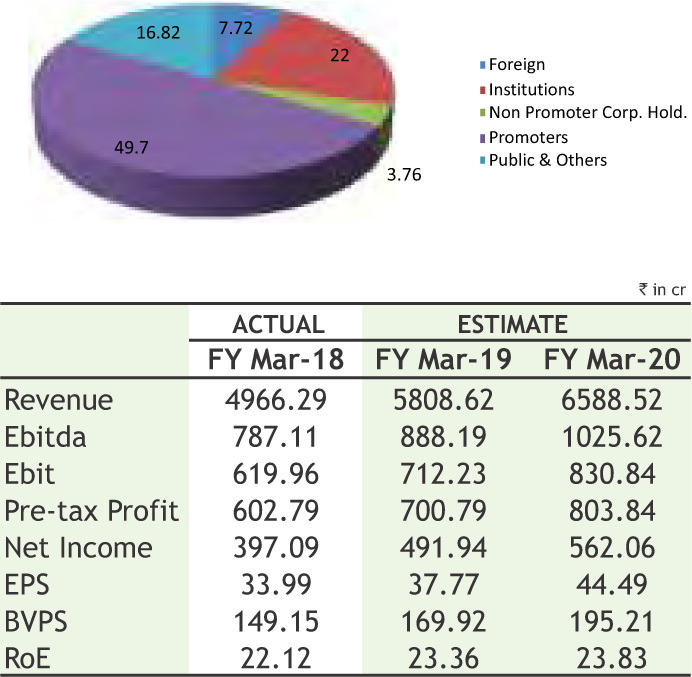
% OF SHARE HOLDING

Investment Rationale

• Supreme Industries limited offers wide range of plastic products in Moulded Furniture, Storage & Material Handling Products, XF Films & Products, Performance Films, Industrial Moulded Products, Protective Packaging Products, Composite Plastic Products, Plastic Piping System & Petrochemicals.

• Plastic pipes contributes around 54% of total sales, followed by industrial 20%, packaging 16%, consumer 7% and others including composite cylinders. The comprehensive range of offerings has reduced dependency on any one end-user industry. The company has plans to increase the capacity to seven lakh tonnes by FY 2021 from the current capacity of five lakh tonnes. Most of the capex undertaken will be to make high value- added products that are expected to give operating profit margins of more than 17%.

• On the developmental front, new plant to manufacture Industrial Components at Rajasthan has commenced commercial production during September, 2018. Capacity of Roto Moulded products at Malanpur and at Kanpur has become operational. The Production of Furniture and Roto Moulded production at Telangana unit has also gone into production during Q2 FY19. The production of Foam products at the plant is expected to start in the quarter ending March 2019.

• Post stabilisation of the goods and services tax regime, there is steady formalisation of the economy, allowing capturing a higher market share. Also, prices of crude oil have come down and the rupee is showing some appreciation. As a result, prices of polymer, raw material for plastics producers, have come down from the high levels.

These developments should help in improving the profit margins going forward. Moreover, lower raw material prices are expected to reduce the requirement of working capital.

Risk

• High competition in the industry

• Threat from substitute products & technology

Valuation

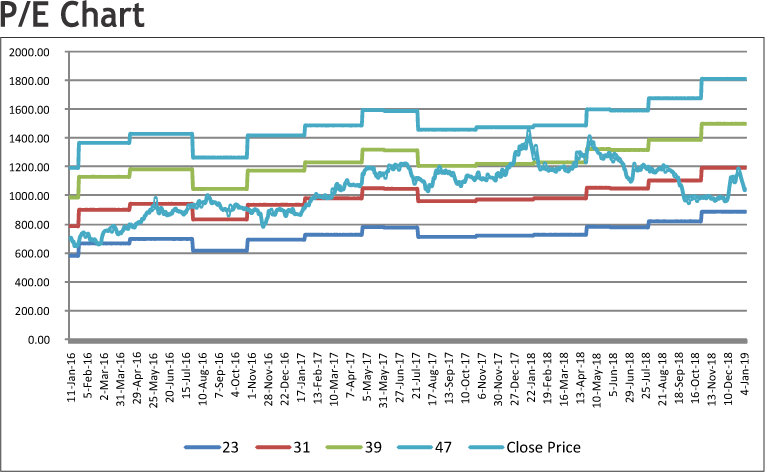
Strong fundamentals and competitive advantages place Supreme Industries in a favorable position to bank on the robust long-term industry prospects. Substitution of materials by plastic products for various applications and growth in key end-user industries are likely to drive consumption of plastic products in India. A diversified, innovative product basket with wide distribution reach across the country, a strong balance sheet and an experienced management team will bore well for the company. We expect the stock to see a price target of Rs. 1,242 in 8-10 months time frame on an expected P/Ex of 27.92 and FY20E EPS of 44.49.

JAGRAN PRAKASHAN LIMITED

CMP: 115.30

Target Price:134

Upside:16%

VALUE PARAMETERS

Face Value (Rs.) 2.00
52 Week High/Low 192.20/102.05
M.Cap (Rs. in Cr.) 3417.63
EPS (Rs.) 9.56
P/E Ratio (times) 12.07
P/B Ratio (times) 1.95
Dividend Yield (%) 2.73
Stock Exchange BSE

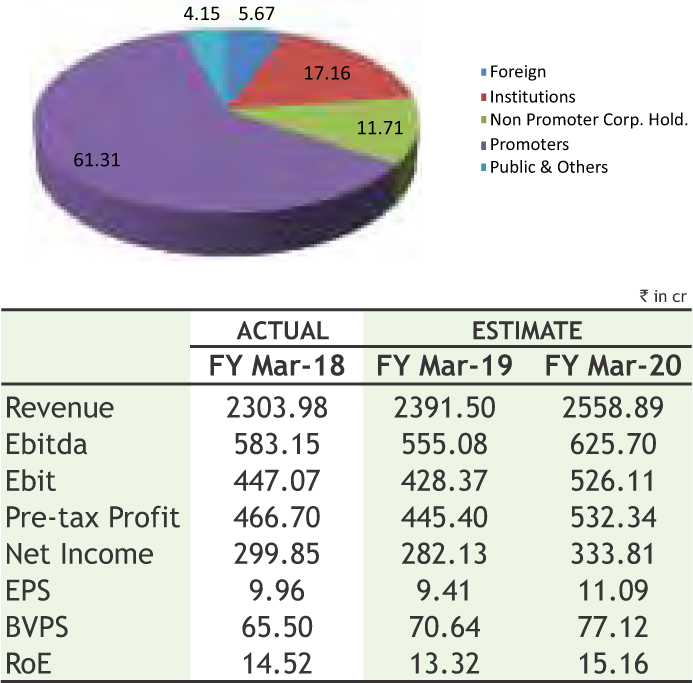
% OF SHARE HOLDING

Investment Rationale

• Jagran Prakashan Limited is a leading media house of India with interests spanning across newspapers, magazines, outdoor advertising, promotional marketing, event management, on ground activities and digital businesses. Under segment of print media, with 10 titles across 13 states in 5 different languages and a total readership of 68 mn, Jagran is the largest print media group of the country.

• Recently, the Ministry of Information and Broadcasting has taken a decision to revise the advertisement rates for print media by announcing a hike of 25 per cent over and above the existing rate structure for advertisement in print media by the Bureau of Outreach and Communication. The decision is with immediate effect and will be valid for a period of three years. According to the management of the company, the decision will be of great benefit towards adversiment revenue and the yield improvement on both YoY & QoQ basis.

• During the quarter ended September 2018, Radio, Digital and Nai Dunia performed strongly in spite of shift of festive season to Q3. Growth in advertisement revenue for Nai Dunia was 9% in Q2 and 5% in H1, which was driven by local revenues that grew by 38% and 29% respectively.

• The company further strengthened its No. 1 position in the country in any language including English with a “Total Readership” of over 7 crores. It is ahead of the No.2 newspaper Hindustan by a significant margin of 1.8 crores readers, a lead of 34%.

• The Company’s another subsidiary Music Broadcast Limited(“MBL”), which operates Radio City, is the first private FM radio broadcaster in India. MBL has expanded itspresence from 4 cities in 2001 to 39

cities in 2018 and is present in 12 out of the top 15 cities in India by population. It also operates 52 web radio stations, through its digital interface,www.radiocity.in in 11languages, which has a listenership of 45mn as of September 2018. Radio operating revenue grew 33% to Rs 80.14 crore and management expects to grow radio advertisement revenue by 10-12%.

Risk

• Competition

• Over dependence on advertisement revenue

Valuation

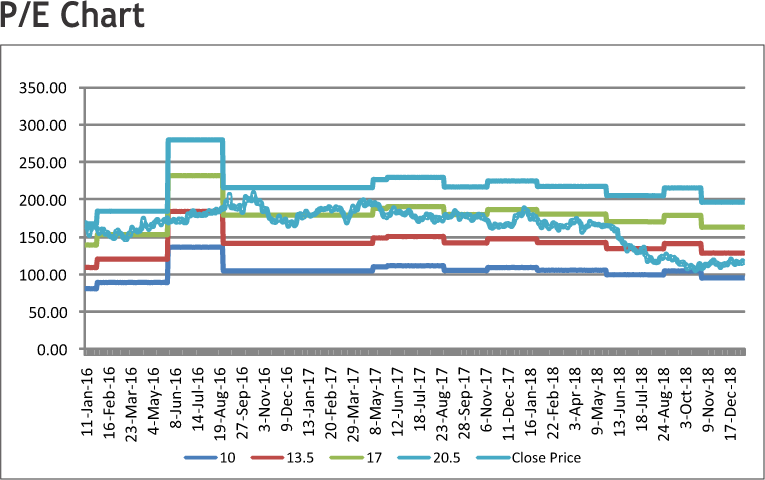
Over the years, the company has gained strong foot print in the media and communications space. Going forward, it is expected to benefit from the expansion in regional language newspaper readership and growth in ad revenue. It enjoys leadership in terms of readership among the Hindi language newspapers, we expect the stock to see a price target of Rs 134 in 8 to 10 months time frame on a one year average P/E of 12.07x and FY20 (E) earnings of Rs.11.09.

Source: Company Website Reuters Capitaline

Above calls are recommended with a time horizon of 8 to 10 months.


6

EQUITY


Beat the Street-Technical Analysis

Godfrey Phillips India Limited (GODFRYPHLP)

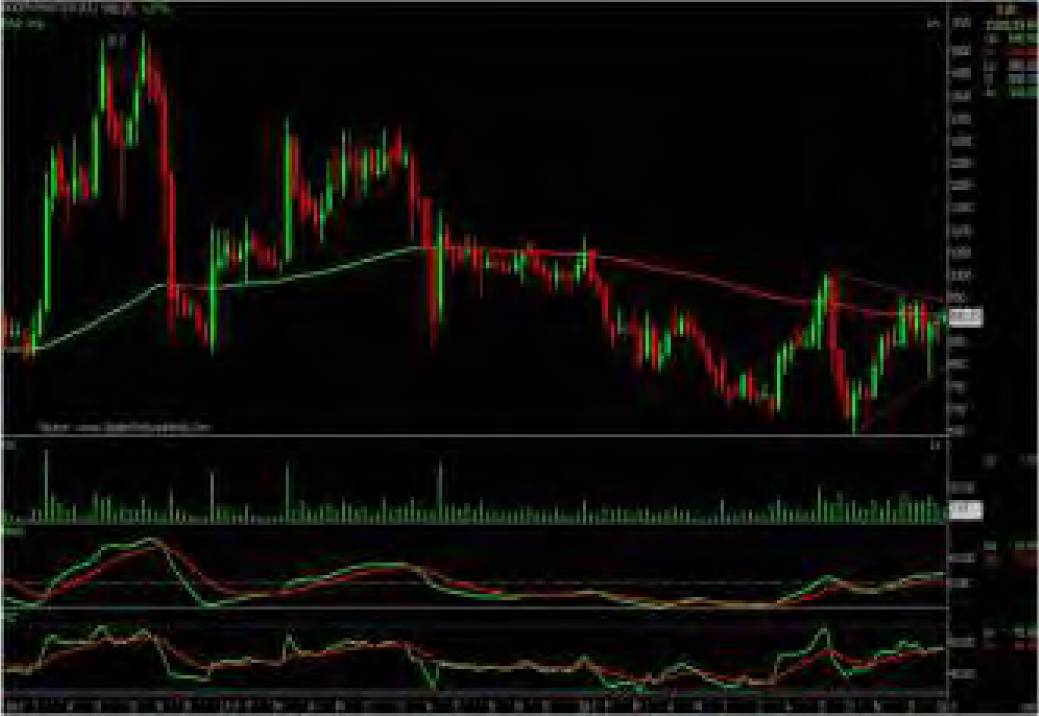
The stock closed at Rs 908.25 on 11th January, 2019. It made a 52-week low at Rs 640.25 on 08th October 2018 and a 52-week high of Rs. 1080 on 12th January 2018. The 200 days Exponential Moving Average (DEMA) of the stock on the daily chart is currently at Rs 852.52

As we can see on charts that stock is consolidating in the wide range of 700 to 950 levels and has formed a “Triangle” pattern on weekly charts and is likely to give the breakout of pattern. Last week, stock ended with marginal gains but ended to close above 100 WEMA along with rising volumes, which indicates that buying is aggressive for the stock. Therefore, one can buy in the range of 895-905 levels for the upside target of 980-1000 levels with SL below 850.

Muthoot Finance Limited (MUTHOOTFIN)

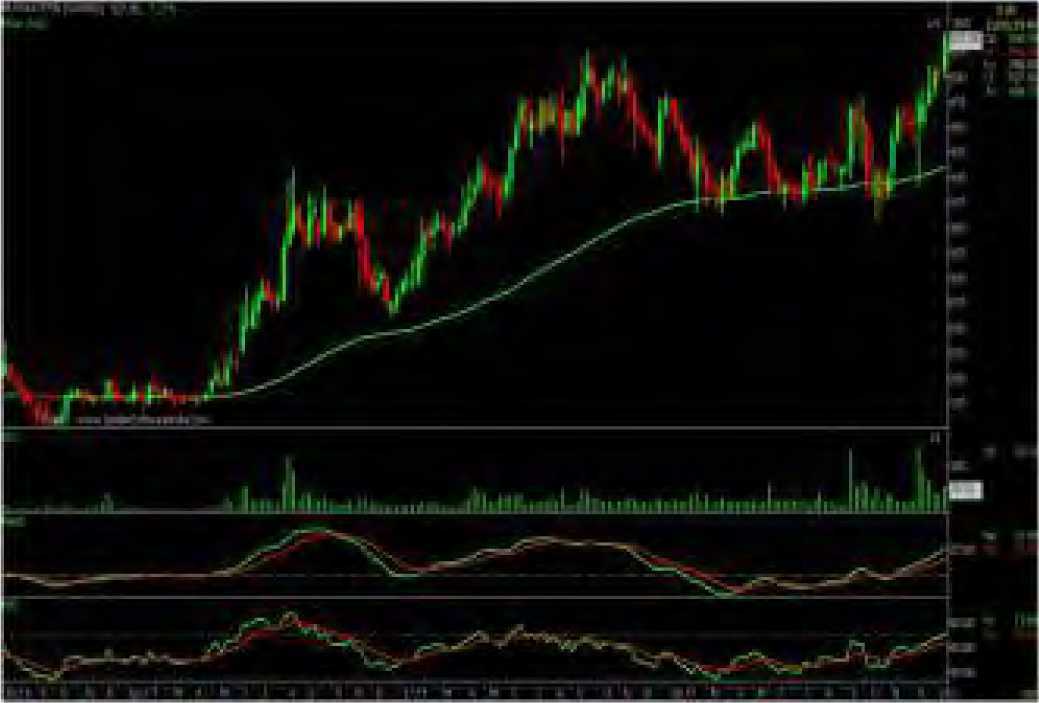
The stock closed at Rs 537.95 on 11th January, 2019. It made a 52-week low at Rs 356 on 09th October 2018 and a 52-week high of Rs. 545.35 on 11th January 2019. The 200 days Exponential Moving Average (DEMA) of the stock on the daily chart is currently at Rs 438.21

Short term, medium term and long term bias are positive for the stock as it is continuously trading in higher highs and higher lows on weekly charts and registered all time high during last week and has also managed to close with long bullish candle, which summaries further upside from current levels. On the technical indicators front, MACD and RSI also suggest buying for the stock. So one can initiate long in the range of 525-530 levels for the upside target of 570- 580 levels with SL below 495.


Disclaimer : The analyst and its affiliates companies make no representation or warranty in relation to the accuracy, completeness or reliability of the information contained in its research. The analysis contained in the analyst research is based on numerous assumptions. Different assumptions could result in materially different results.

The analyst not any of its affiliated companies not any of their, members, directors, employees or agents accepts any liability for any loss or damage arising out of the use of all or any part of the analysis research.

SOURCE: CAPITAL LINE

Charts by Spider Software India Ltd

Above calls are recommended with a time horizon of 1-2 months

7

DERIVATIVES


WEEKLY VIEW OF THE MARKET


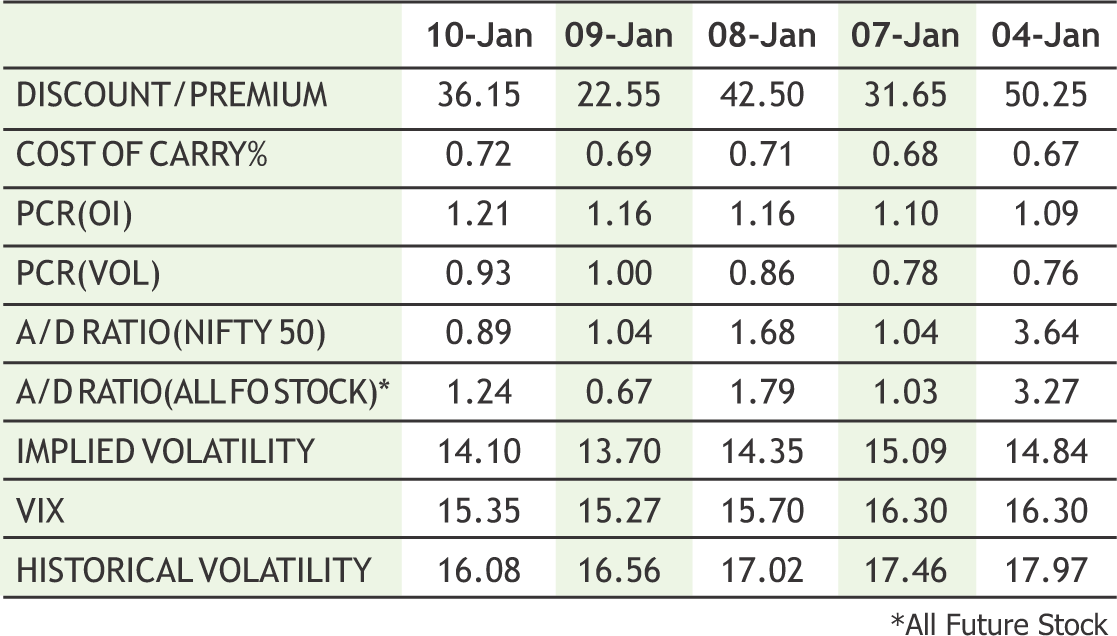
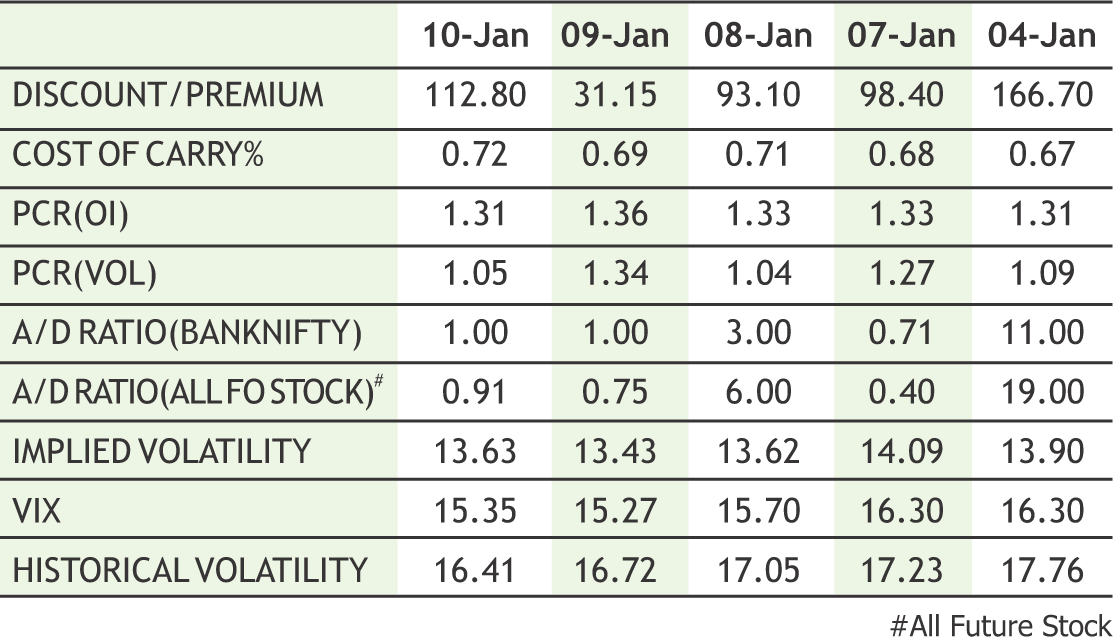
The Market Undertone remained bullish with support of consistent short covering from lower levels. Nifty is trading near support levels at 10750 and heavy weight sector like Banks, FMCG supporting the market trend. Sector rotation is likely to continue further. Derivative data indicates bullish scenario to continue. Nifty has multiple supports at lower levels. Various supports are 10700 & 10750 spot levels. Short covering may be seen on every dip. Option writers were active in recent rally. Put writing was seen in 10500 and 10600 strike puts. The Implied Volatility (IV) of calls closed at 14.10% while that for put options closed at 14.20%. The Nifty VIX for the week closed at 15.35% and is expected to remain sideways. Among Nifty Call options, the 11000-strike call has the highest open interest of more than 45 lakh shares and in put side 10500-strike put has the highest open interest of over 35 lakh shares in open interest respectively. The PCR OI for the week closed up at 1.21, which indicates OTM put writing. On the technical front, 10700-10750 spot levels is the support zone and current trend is likely to continue towards 10850-10900 levels.


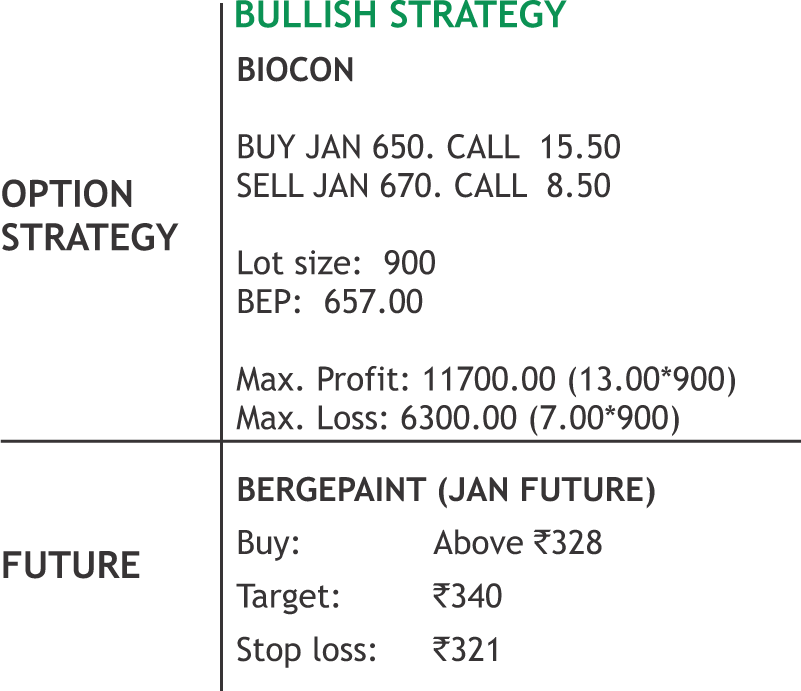
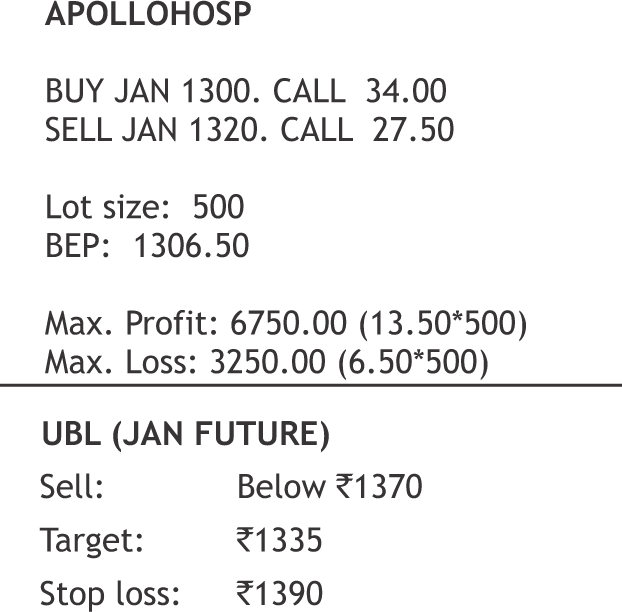
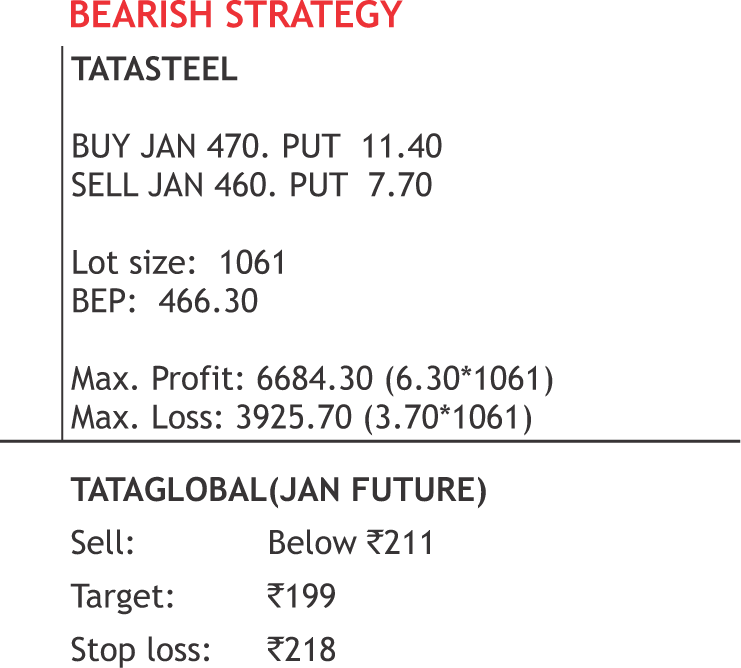
DERIVATIVE STRATEGIES


NIFTY OPTION OI CONCENTRATION (IN QTY) (MONTHLY)


CHANGE IN NIFTY OPTION OI (IN QTY) (MONTHLY)


BANKNIFTY OPTION OI CONCENTRATION (IN QTY) (MONTHLY)


CHANGE IN BANKNIFTY OPTION OI (IN QTY) (MONTHLY)


8

DERIVATIVES


SENTIMENT INDICATOR (NIFTY)


SENTIMENT INDICATOR (BANKNIFTY)


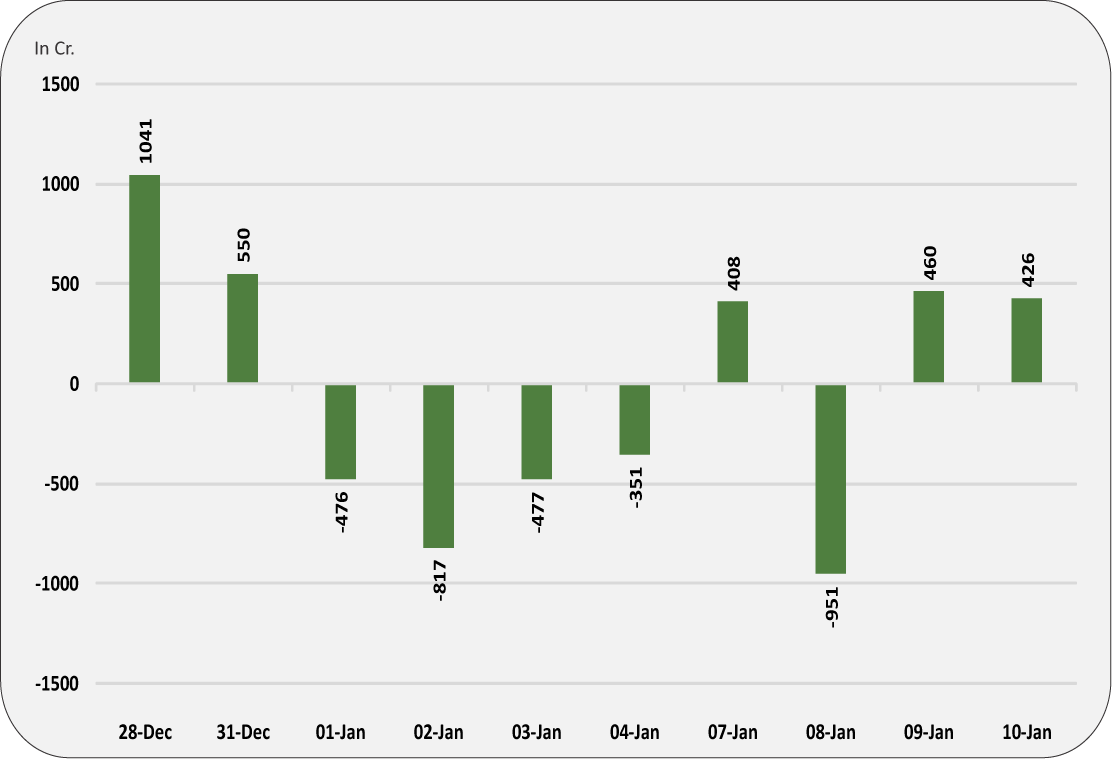
FII’S ACTIVITY IN INDEX FUTURE


FII’s ACTIVITY IN DERIVATIVE SEGMENT


Top 10 Rollover


Bottom 10 Rollover


**The highest call open interest acts as resistance and highest put open interest acts as support.

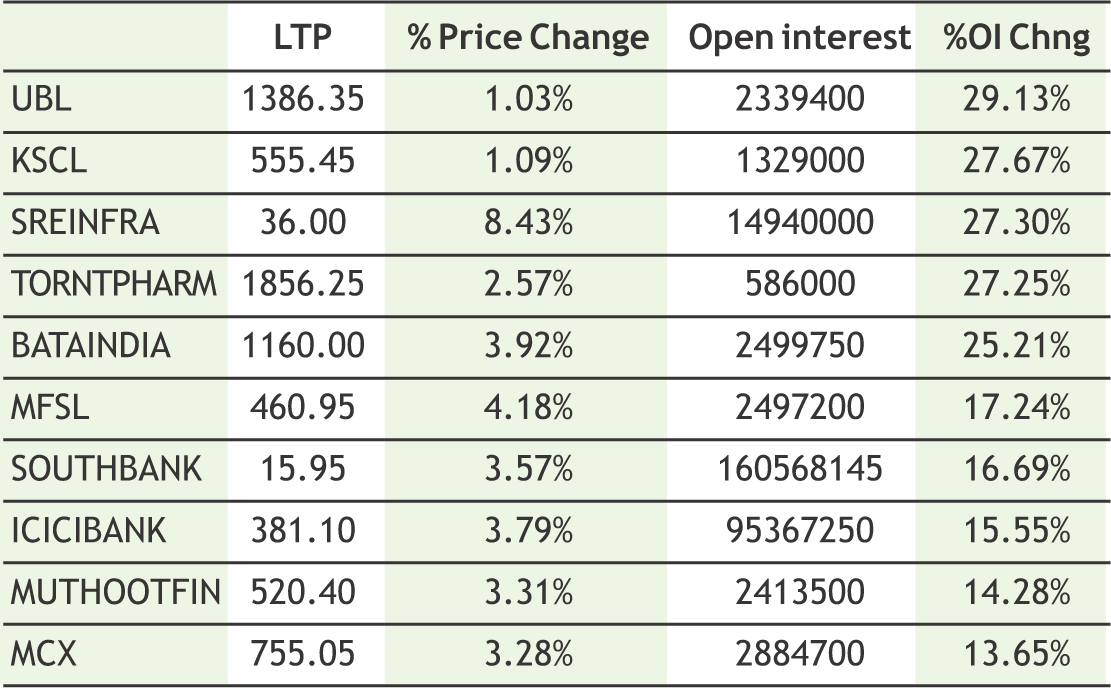
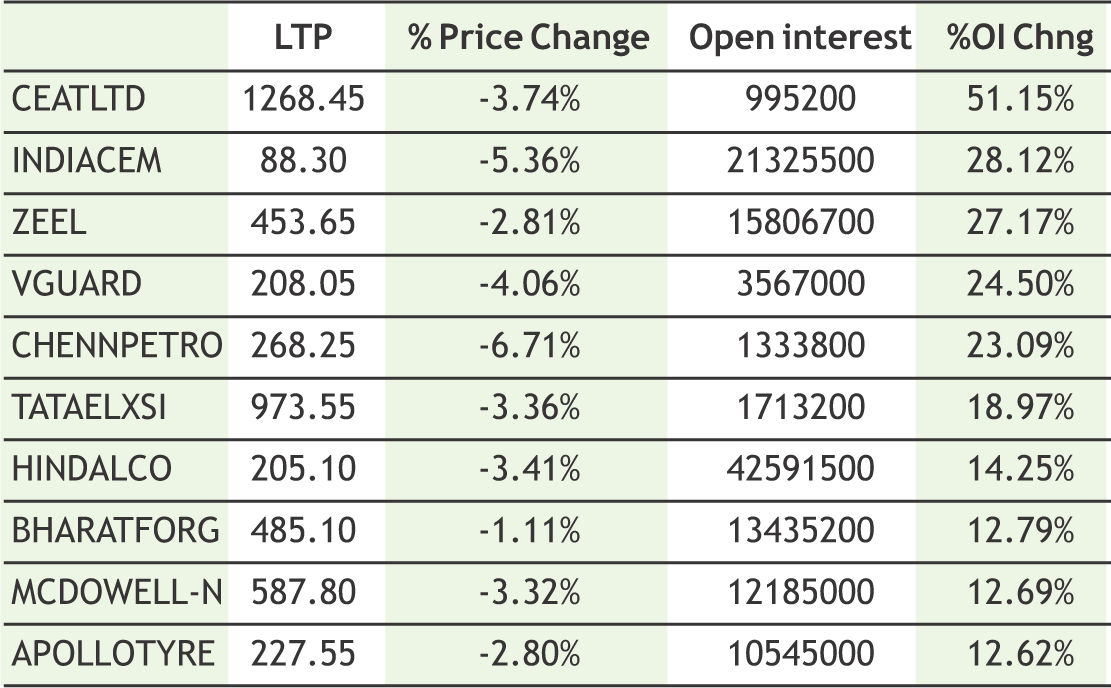
# Price rise with rise in open interest suggests long buildup | Price fall with rise in open interest suggests short buildup

# Price fall with fall in open interest suggests long unwinding | Price rise with fall in open interest suggests short covering


9

COMMODTY


SPICES


Turmeric futures (Apr) may continue to take support near 6550-6480 levels & show upside momentum to test 6785-6850 levels. The spot prices are on a rising trend at the markets in Erode despite rise in arrivals. The stockists are showing good interest in procuring as they are counting on anticipation of more upside in days to come. At present, there is a good demand for new turmeric as compared to old one. On the supply side, in Maharashtra and Tamil Nadu the crop is still there in field & needs some shower otherwise yield may get affected. The downtrend of jeera futures (Mar) is likely get paused taking support near 16700 levels. This week, lower level buying may emerge in the counter & the counter is expected to move higher towards 17500 levels. Going ahead, the condition of the crop will also be a major factor to watch for because the cumin crop faces severe weed competition at all stages of crop growth because of slow growth and short stature. Secondly, the carryover stocks of jeera are seen at 200,000-300,000 bags (1 bag = 55 kg), way less than the desirable 500,000 bags. The new crop will only start arriving in February. The uptrend of coriander futures (Apr) is expected to remain intact & it may surpass 6900 levels. In between any correction due to profit booking may get limited to 6500 levels. The price outlook is bullish till the arrivals hit the markets & this year there might be a shortage. New crop arrivals will increase from mid-February as the standing crop is almost ready for harvesting in major producing belts.

BULLIONS


Bullion counter upside momentum may continue further as dovish statement from Fed Chairman, Jerome Powell confirmed slowdown in the rate hike in 2019, which might restrict the gains for the Dollar Index. Fed Chairman stated that the U.S. central bank can be patient in approving any further rate increases as officials gauge whether the U.S. economy will slow this year. However, on domestic bourses some appreciation in local currency can cap the upside. Gold can again test the level of 32500 taking support near 31700 while silver can move further northwards and can test 40100. FOMC minutes and comments from Fed officials have cemented market expectations that Fed may not consider rate hike in the near term as it awaits more clarity. Gold holdings with SPDR ETF stood at 797.706 tonnes while silver holdings with iShares ETF stood at 9755.07 tonnes. World Gold Council expects increased market uncertainty and expansion of protectionist economic policies to make gold attractive as a hedge while it might face some hindrances from higher interest rates and a strong dollar. But the effects of these factors are expected to be limited as the US Fed has signalled a neutral stance going forward. Fears on slowing economic growth and the uncertainties around the Federal Reserve's monetary policy have stirred the financial markets for a few months. Risk assets took a big hit in 2018, with the stock market suffering the worst December since the Great Depression.


OIL AND OILSEEDS


The trend of soybean futures (Feb) is bullish & hence lower level buying is advised near 3550-3520, eyeing a target of 3700 levels. Recently, Iranian market has opened up for Indian soybean meal with favourable factor is rupee transactions. Iran has revised its payment mechanism for trading partners such as India, and accepts payments in rupees as well as uses the same fund to pay to India for its imports. On the contrary, the outlook for mustard futures (Feb) is bleak & the downside may get extended towards 3750-3700 levels. The selling may get intensified as the new crop is expected to hit the spot markets soon. Meanwhile, the demand side may remain dull on reports that the export of rapeseed meal to China is unlikely to resume during current financial year as procedure for registration with MoA, China is too cumbersome, lengthy and time consuming to complete all formalities. In days to come, more upside towards 553 levels can be seen in CPO futures (Jan) on the back of a weaker rupee, making imports costlier. However, investors are advised to proceed with caution as the fundamentals of palm oil in the international market have turned bearish after the Malaysian Palm Oil Board reported that Malaysia's palm oil stockpiles at the end of December rose to 3.22 million tonnes, up 6.9 percent from previous month. Ref. soy oil futures (Feb) is expected to gain for the third consecutive week & test 760 levels on account of rising soybean prices & positive gross crush margin of Rs.1,116 per ton. The rising open interest since past few weeks is also injecting optimism that prices of edible oils would gain grounds in days to come.

ENERGY COMPLEX


Crude oil prices may continue to move northwards as markets anticipates extension of supply cuts by OPEC that might tighten the supply market. Crude oil prices are expected to remain on buoyant path and can test 3900 in MCX. Meanwhile, Iran crude exports stayed lower in January and were struggling to find new buyers, and went below 1 million bpd, from regular sales of 2.5 million bpd before sanctions. Crude exports from the Middle East for the first week of 2019 increased by 4.28 million bbl w-o-w to 122.38 million bbl. The gain came on the back of higher exports from the UAE, Saudi Arabia and Oman with the Emirates recording the highest weekly gain amongst its regional counterparts. OPEC oil supply fell in December by 460,000 barrels per day, to 32.68 million bpd. The aim of the production cut is to rein in a surge in global supply, driven mostly by the United States, where production grew by nearly a fifth to over 11 million bpd in 2018. The natural gas counter can continue to hover in narrow range as the steeps downfall witnessed last month seems to have paused. Its prices can take support 200 levels and upside will remain capped near 225. U.S. natural gas prices have fallen sharply as the unusual cold weather of late November and early December has given way to warmerthan-normal temperatures in the last four weeks. The U.S. entered the peak winter demand season with gas inventories at a 15-year low, which left the natural gas markets vulnerable to unexpected bouts of cold weather.


OTHER COMMODITIES


Cotton futures (Jan) may witness a consolidation in the range of 20350-20900 levels & trade with a downside bias. Despite the fact of shortage this season, the prices are showing a negative trend due to sluggish demand. The lethargic buying has hit the entire cotton value chain, as a result of which there is a cash crunch amongst the market participants in the physical market and money has been locked up in inventories, prompting yarn manufacturers to cut prices. On the export front also, China is not buying much yarn due to which the supplies are not replenishing and the payment cycle is getting affected. Guar seed futures (Feb) is expected to break the major support near 4180 & test 4050 on the downside; while guar gum futures (Feb) will possibly descend towards 7900 levels. The guar gum and guar seed ratio has fallen to 1.97, continuously declining since November last year. This denotes that the underlying demand for guar gum is discouraging due to lower than expected export demand. According to the market participants, export of guar gum is though positive this FY 2018-19, but not sufficient to lift market sentiments. Day’s ahead, there are very less chances that chana futures (Mar) may not break the support levels of 4250 as the sentiments are still weak due to continued selling of stock at lower rates by Nafed. The latest statistic show that there is a balance of 8519.41 MT in Andhra Pradesh, 7951 MT in Telangana, 41964.76 MT in Karnataka, 144591.03 MT in Maharashtra, a whooping inventory of 1552153.52 MT in Madhya Pradesh & 467656.77 MT in Rajasthan respectively.

BASE METALS


In base metal counter, prices can extend its recovery on growing optimism regarding US and China trade deal. U.S. officials expect China's top trade negotiator may visit Washington this month, signaling that higher-level discussions are likely to follow last week's talks with mid-level officials in Beijing as the world's two largest economies try to hammer out a deal to end a tit-for-tat tariff war. China's commerce ministry stated that trade talks with the United States were extensive and detailed, and established a foundation for the resolution of each other’s concerns. Copper may recover further towards 425 levels while taking support near 405 levels. Copper concentrate exports from Indonesia's Grasberg mine, the world's second-largest copper mine, are forecasted to plunge this year because of a lag in output as operations move from open pit to underground mining. Copper production in Chile reached 5.33 million tonnes in November, a 6% increase over the same period of the previous year. Meanwhile Lead may find strong support near 136 levels and can bounce towards 145 levels. Aluminium can witness further lower level buying as it can recover towards 135 taking support near 127 levels. U.S. plans to remove sanctions on Russian aluminium giant Rusal will be of limited benefit to consumers in the United States. Norwegian aluminium-maker Norsk Hydro aims to resume full production at its Alunorte alumina plant in Brazil within weeks or months. Zinc can bounce further and can test 180 levels. Nickel prices are also expected to continue its recent recovery as it can test 825 levels taking support near 780 levels.

10

COMMODTY


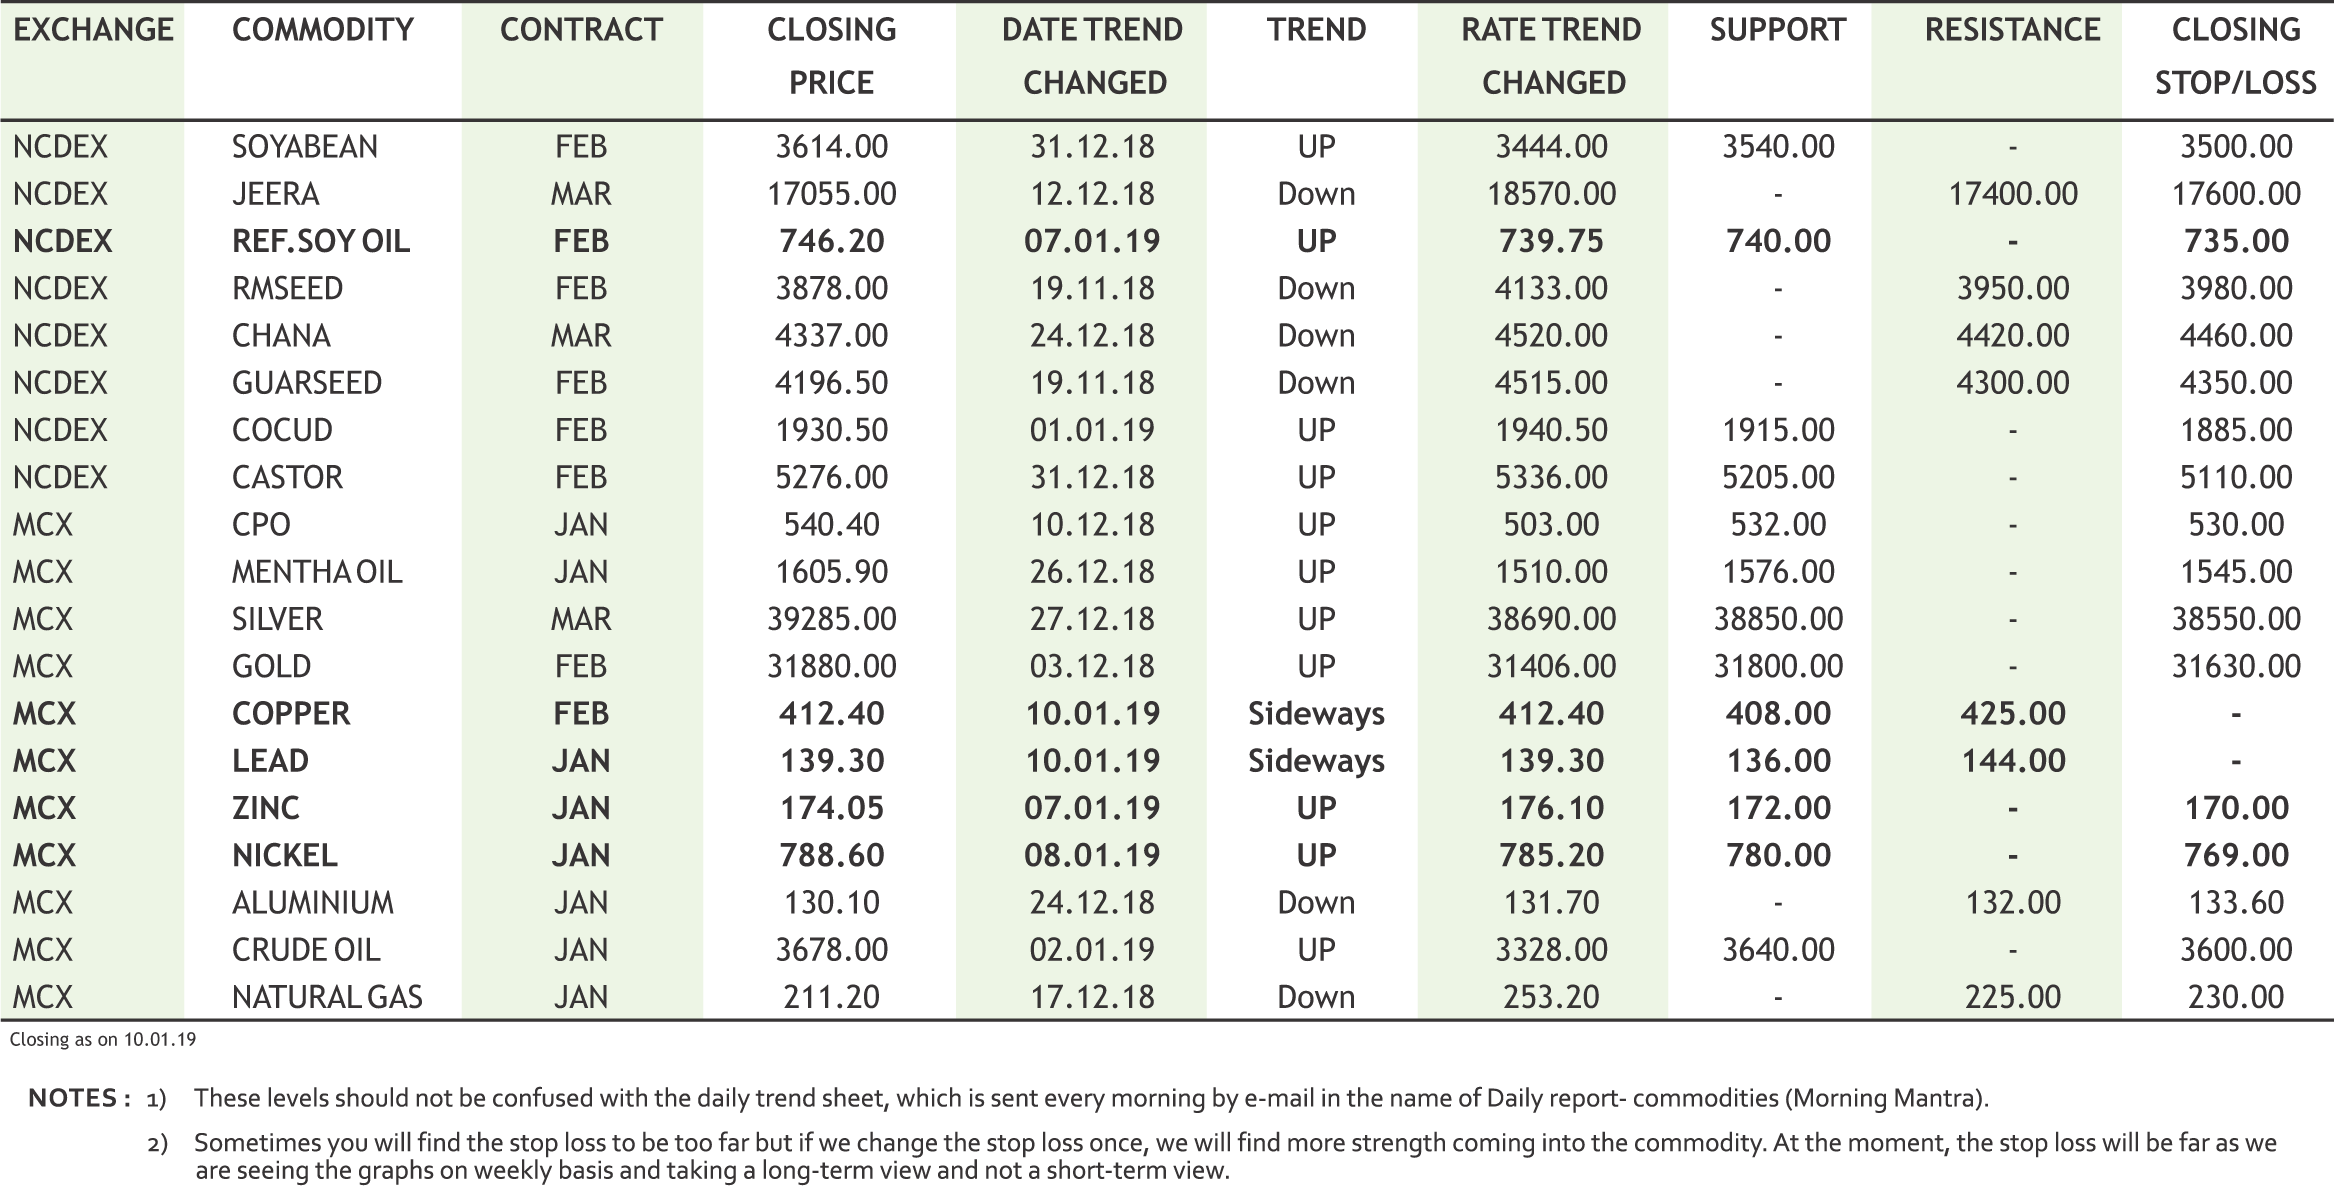
TREND SHEET


TECHNICAL RECOMMENDATIONS


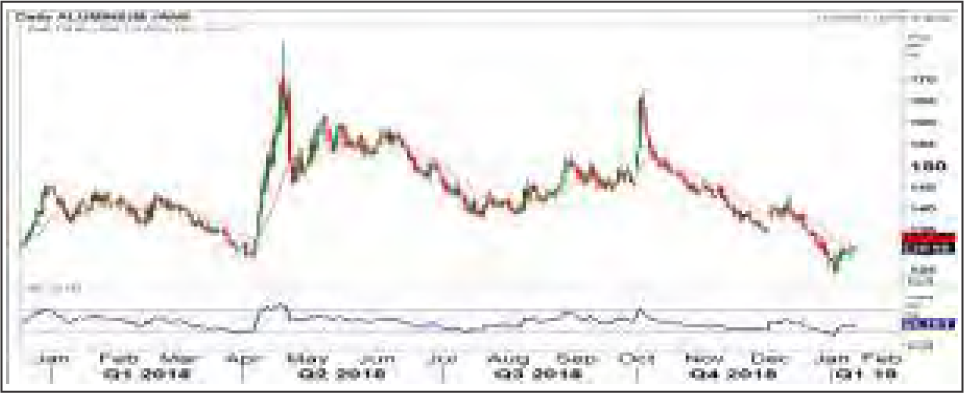
ALUMINIUM MCX (JAN) contract closed at Rs. 130.10 on 10th Jan’19. The contract made its high of Rs. 142.50 on 10th Dec’18 and a low of Rs. 124.75 on 2nd Jan’19. The 18-day Exponential Moving Average of the commodity is currently at Rs. 131.30. On the daily chart, the commodity has Relative Strength Index (14-day) value of 45.89.

One can sell below Rs. 129.50 for a target of Rs. 125.50 with the stop loss of Rs. 131.50.


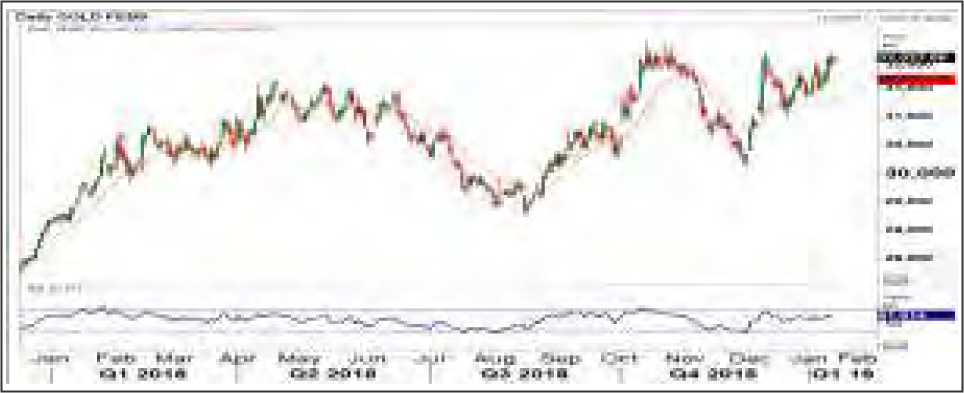
GOLD MCX (FEB) contract closed at Rs. 31880 on 10th Jan’19. The contract made its high of Rs. 32530 on 15th Oct’18 and a low of Rs. 29838 on 16th Aug’18. The 18-day Exponential Moving Average of the commodity is currently at Rs. 31640. On the daily chart, the commodity has Relative Strength Index (14-day) value of 59.55.

One can sell at Rs. 32100 for a target of Rs. 31700 with the stop loss of Rs. 32300.

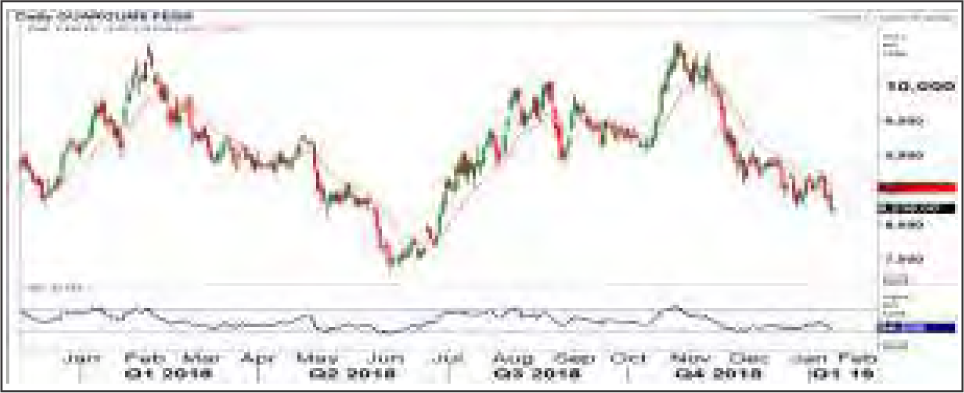
GUARGUM NCDEX (FEB) contract was closed at Rs. 8235 on 10th Jan’19. The contract made its high of Rs. 10111 on 16th Nov’18 and a low of Rs. 8181 on 10th Jan’19. The 18- day Exponential Moving Average of the commodity is currently at Rs. 8563. On the daily chart, the commodity has Relative Strength Index (14-day) value of 31.935.

One can buy at Rs. 8150 for a target of Rs. 8550 with the stop loss of Rs 7950.


11

COMMODTY


NEWS DIGEST


• Vedanta's south Indian copper smelter which was ordered to shut permanently in May got approval from India's Supreme Court to resume production by refusing to stay an order from the country's environmental court.

• Cochilco stated in a report that output from Chile could reach a record of 7.25 million tonnes as early as 2025.

• China's central bank cut RRR for banks for the fifth time in a year, freeing up $US116 billion for new lending.

• India has begun paying Iran for oil in rupees, the first such payments since US imposed new sanctions against Tehran in November.

• Malaysia's palm oil stockpiles at the end of December rose to 3.22 million tonnes, up 6.9% from previous month. - Malaysian Palm Oil Board (MPOB)

• The overall export of oilmeals during April to December 2018 is reported at 2,387,028 tons compared to 2,246,989 tons during the same period of last year i.e. up by 6%. - Solvent Extractors’ Association of India

• The Maharashtra State Cooperative Bank has agreed to extend a loan to sugar mills in the state, enabling them to immediately export about 700,000 tonnes of sugar.

• RBI has made some changes in the Gold Monetisation Scheme (GMS). Apart from individual and joint depositors, the scheme could now be availed by charitable institutions, the central government, the state government or any other entity owned by the central government or the state government.

WEEKLY COMMENTARY


In the week gone by, commodity market witnessed good moves and CRB jumped above 185. Earlier CRB has made a low of 174.22 on correction. Dollar index hit the low of 95, which also propped up commodities prices last week. Dollar fell versus its major peers, as investors grew increasingly confident that the U.S. Federal Reserve may hit the pause button on monetary tightening this year. Fed Chairman Jerome Powell repeated on Thursday the U.S. central bank has the ability to be patient on monetary policy given that inflation remains stable. Base metals saw some fresh buying but again upside was capped due to lack of concrete details from the United States and China on any progress in their trade dispute after a three-day meeting in Beijing. The two sides are more than halfway through a 90-day truce agreed by U.S. President Donald Trump and his Chinese counterpart Xi Jinping. Crude jumped on Wednesday by 5%. The rally came as China said trade talks with the U.S. were “extensive and detailed,” and that both sides agreed to continue to keep in close contact. In NYMEX, it breached the mark of 52 levels and in MCX, it crossed 3700 levels. Iran's crude exports in November plummeted to below 1 million barrels per day, from regular sales of 2.5 million bpd before sanctions were imposed in May. Natural gas bounced back from the lower levels on fresh buying amid decline in inventory. The U.S. Energy Information Administration (EIA) reported Thursday morning that U.S. natural gas stockpiles decreased by 91 billion cubic feet for the week ending January 4. Gold prices edged up after the U.S. dollar slipped amid growing expectations that the U.S. Federal Reserve would halt its rate tightening cycle in 2019. It was continuous four week upside journey of gold whereas silver prices slipped on profitbooking. The inverse correlation between gold and the US 10-year yield is currently at its strongest in 12 months. .

In agri counter, guar prices nosedived despite higher crude prices. Mentha tried to trade in upper zone but the rally seems to be tired at higher levels. In spices; turmeric and cardamom witnessed further upside in the prices on lesser availability whereas jeera gave up its gain on low export demand amid some quality issue. Cotton prices slipped in Punjab, Haryana and upper Rajasthan as buyers remained cautious, tracking overnight weakness in US futures. Edible oil and oil seeds traded negative; tracking losses in US soyoil and on a stronger Ringgit. Ringgit is set for its biggest weekly gain since March as a rally in crude prices eases concern about Malaysia’s fiscal position.

NCDEX TOP GAINERS & LOSERS (% Change)


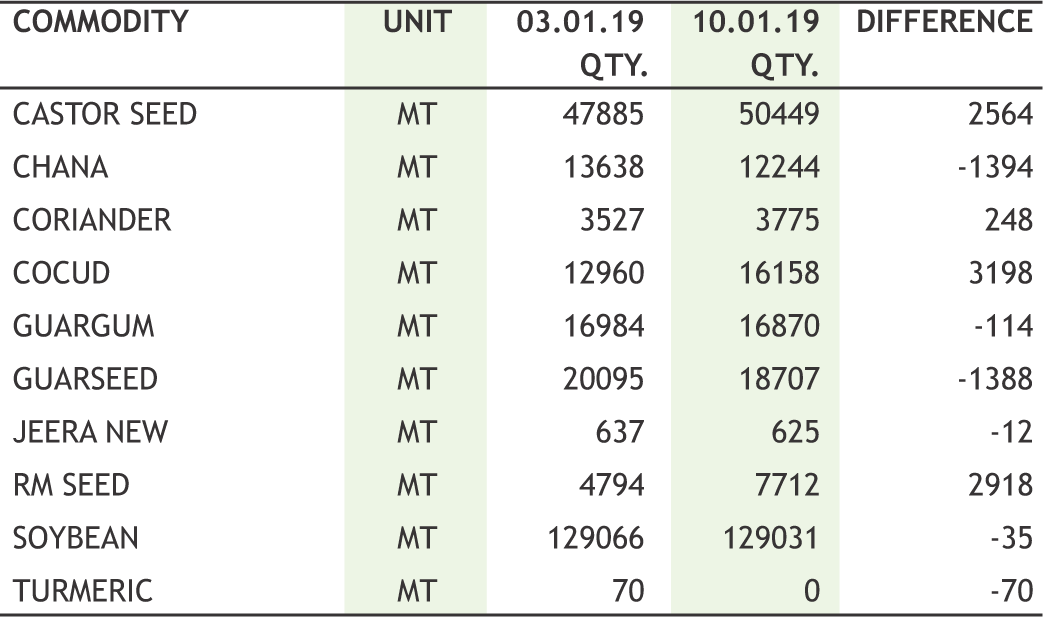
WEEKLY STOCK POSITIONS IN WAREHOUSE (NCDEX)


MCX TOP GAINERS & LOSERS (% Change)


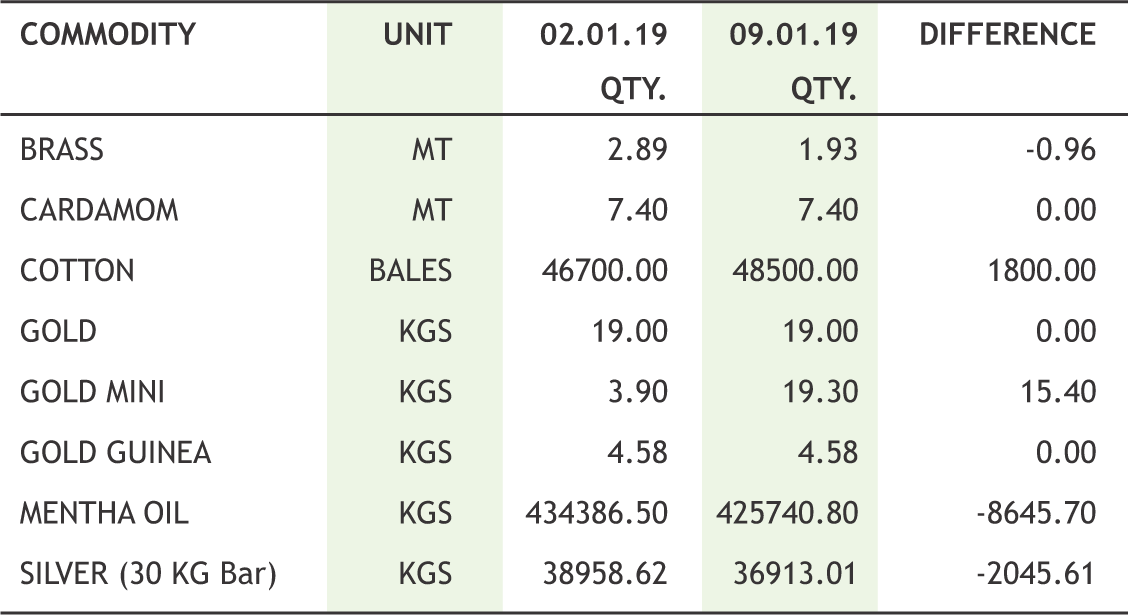
WEEKLY STOCK POSITIONS IN WAREHOUSE (MCX)


12

COMMODTY


SPOT PRICES (% change)


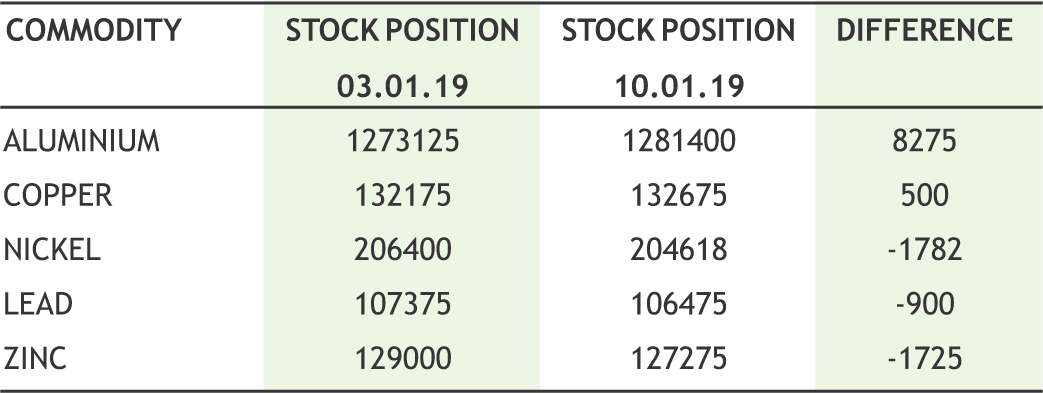
WEEKLY STOCK POSITIONS IN LME (IN TONNES)


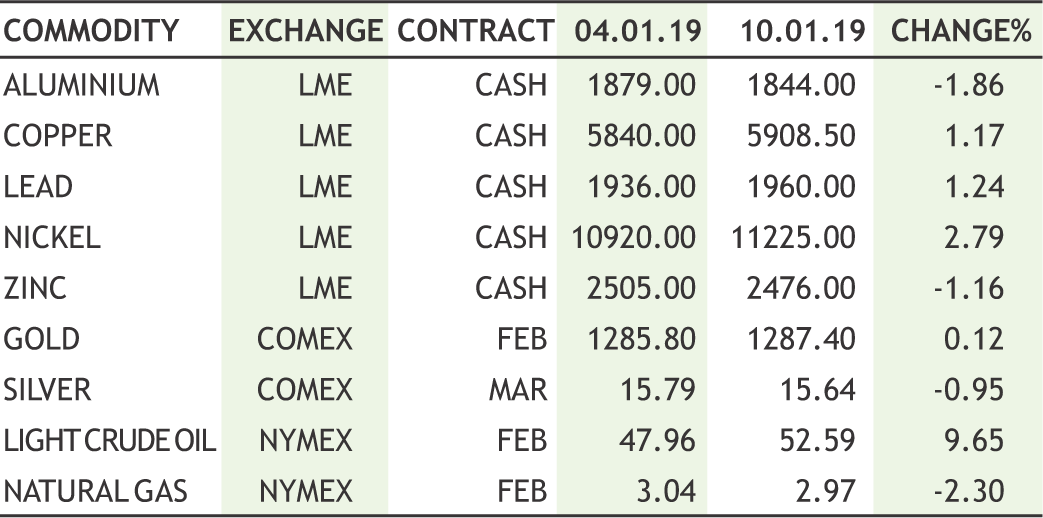
PRICES OF COMMODITIES IN LME/ COMEX/ NYMEX (in US $)


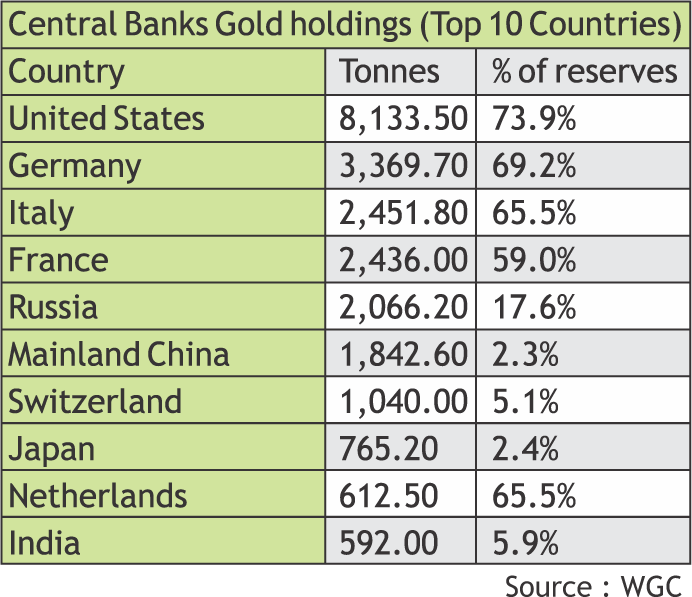
Gold Buying by Central Banks........Amazing love affairs

There is a famous saying: ‘A friend in need is friend indeed’. Gold is a ‘must have’ financial asset indeed’. Not only investors, but also nation’s central banks try to hoard gold in times of crisis as gold is playing a new role in the changing international financial environment.

Love affair of global central banks with gold is amazing

Central banks across the world are aggressively adding gold to their foreign exchange (forex) reserves. According to data from the World Gold Council (WGC), the net gold purchases by central banks till November 2018 stood at 480 tonnes–the highest since 2015. Notably, the central-banks buying have also become geographically more diverse as several new countries adding gold for the first time in decades. According to the WGC, Poland and Hungary are the first EU nations to buy gold since the start of the century. In the case of Hungary, the central bank hiked its gold reserves from 3.1 tonnes to 31.5 tonnes, all in October, its first purchases since 1986.

In 2018, the big players have been Russia, Turkey and Kazakhstan.

• According to the World Gold Council, Russia has continued to buy gold along the lines of 50 to 60 tonnes per quarter, with 159.8 tonnes up to the third quarter. The country has slightly bought above 200 tonnes annually over the last three years.

9 Kazakhstan has been buying 30 to 40 tonnes a year.

• Turkey has bought 54.7 tonnes up to the third quarter of 2018, including 18 ton in the third quarter due to its lot of economic problems.

• Following the global trend, RBI has also bought gold for its reserves, and in little less than a year, the RBI has added nearly 40 tonnes. Part of this increase was related to the gold monetization program.

• After a gap of more than two years, China is back in the game and the People’s Bank of China increased holdings to 59.56 million ounces by the end of December 2018.

Why Central-Bank Gold Buying Picked Up

Gold is a 100 percent guarantee from legal and geopolitical risks. Preserving its historical value, gold continues to be one of the safest assets in the world.

• The gold enhances the long-term stability of countries reserves and strengthens market confidence even under normal market circumstances.

• Considering the uncertainty like volatility or a correction in the global stock markets as well as dollar, central bankers are adding gold to their reserves as a hedge as they don’t want to be caught unawares like they were in 2008.

• Many of these purchases occurred at a time when gold prices were relatively low, especially compared to early this decade when they briefly topped $1,900 an ounce.

• Some Countries want to reduce the amount of U.S. dollar from its forex reserve portfolio and just looking for ways to diversify of reserves as they desire to move from dollar dependent global financial system to multi-polar reserve system.

INTERNATIONAL COMMODITY PRICES


13

CURRENCY


Currency Table


News Flows of last week


7th JAN RBI yet to make a decision on dividend, says Shaktikanta Das.
7th JAN EU to reassure Theresa May with pledge for trade deal by 2021.
8th JAN RBI appoints Nandan Nilekani as chairman of panel on digital payments.
8th JAN US Job Openings fell sharply in November
9th JAN RBI made changes in eligibility criteria for deposits in Gold Monetisation Scheme.
9th JAN Theresa May suffered parliament defeat as Brexit debate restarts.
10th JAN RBI plans to extend implementation of last tranche of 0.625% CCB by a year.

Market Stance


This week Rupee opened strongly but a sudden fall in bond yields changed the sentiments and the move changed its course. After the statements from RBI governor on decision of interim dividend payment to government yet to be made, INR weakened further making the BJP led government with lesser options to reduce fiscal deficit. The lack of positive news flow from domestic markets and Crude oil prices moving higher by more than 24% from lows created fresh demand for dollars from OMC’s. Also, forecasted IIP’s being lower than previous numbers created negative sentiment for INR and forcing USINR to hold above 69 against dollar which are the long term breakout levels for currency pair which are now acting as supports. Meanwhile on the cross currency front, dovish statements from US Federal Reserve officials during the week created the weakness in USD and thus other currencies viz. Euro, Sterling and Yen appreciated on week-on-week basis. Next week, Indian inflation and trade balance numbers are expected to impact INR negatively. Expect USDINR to stay above 70 and gradually move towards 71.

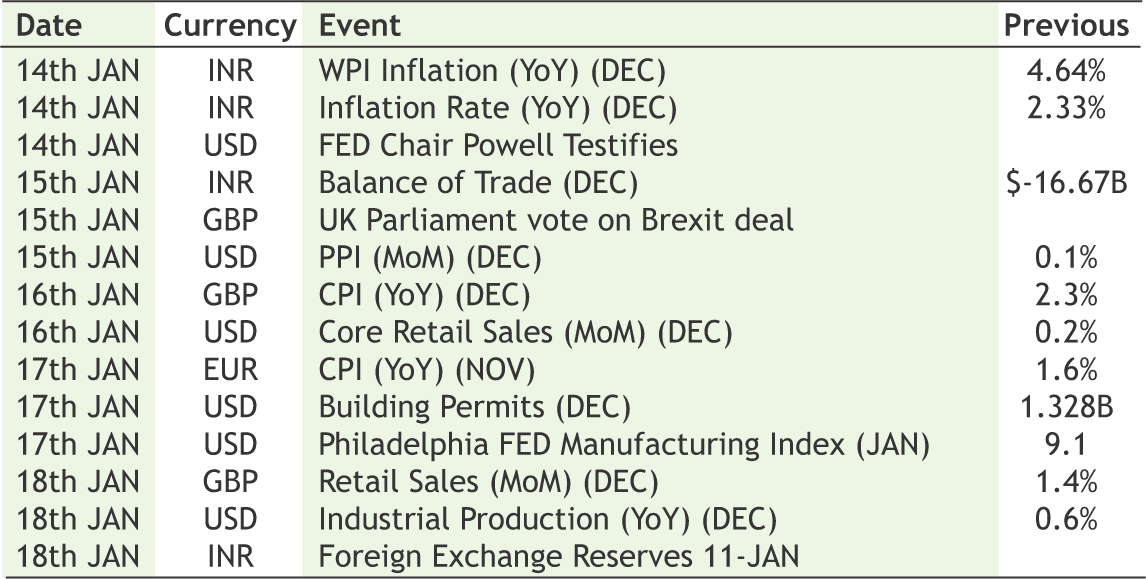
Economic gauge for the next week


Technical Recommendation

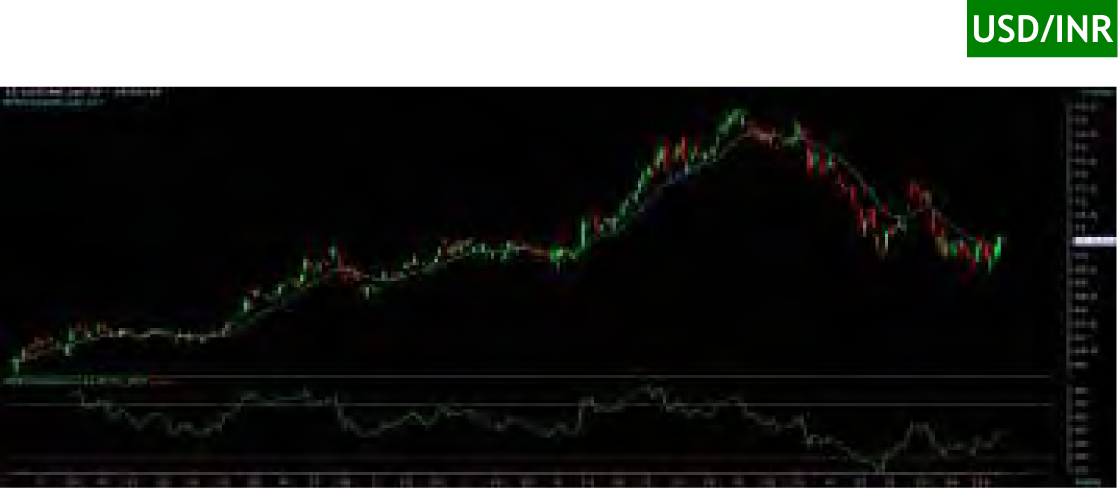
USD/INR (JAN) contract closed at 70.5375 on 10th Jan’ 19. The contract made its high of 70.79 on 9th Jan’19 and a low of 69.38 on 7th Jan’ 18 (Weekly Basis). The 14-day Exponential Moving Average of the USD/INR is currently at 70.41

On the daily chart, the USD/INR has Relative Strength Index (14-day) value of 47.12. One can buy at 70.25 for the target of 70.85 with the stop loss of 69.95.


EUR/INR (JAN) contract closed at 81.46 on 10th Jan’ 19. The contract made its high of 81.95 on 10th Jan’19 and a low of 79.4725 on 7th Jan’19 (Weekly Basis). The 14-day Exponential Moving Average of the EUR/INR is currently at 80.71

On the daily chart, EUR/INR has Relative Strength Index (14-day) value of 54.62. One can buy at 81 for a target of 81.60 with the stop loss of 80.70.

GBP/INR (JAN) contract closed at 90.04 on 10th Jan’ 19. The contract made its high of 90.48 on 10th Jan’19 and a low of 88.56 on 7th Jan’18 (Weekly Basis). The 14-day Exponential Moving Average of the GBP/INR is currently at 89.57

On the daily chart, GBP/INR has Relative Strength Index (14-day) value of 48.32. One can sell below 89.90 for a target of 89.30 with the stop loss of 90.20.

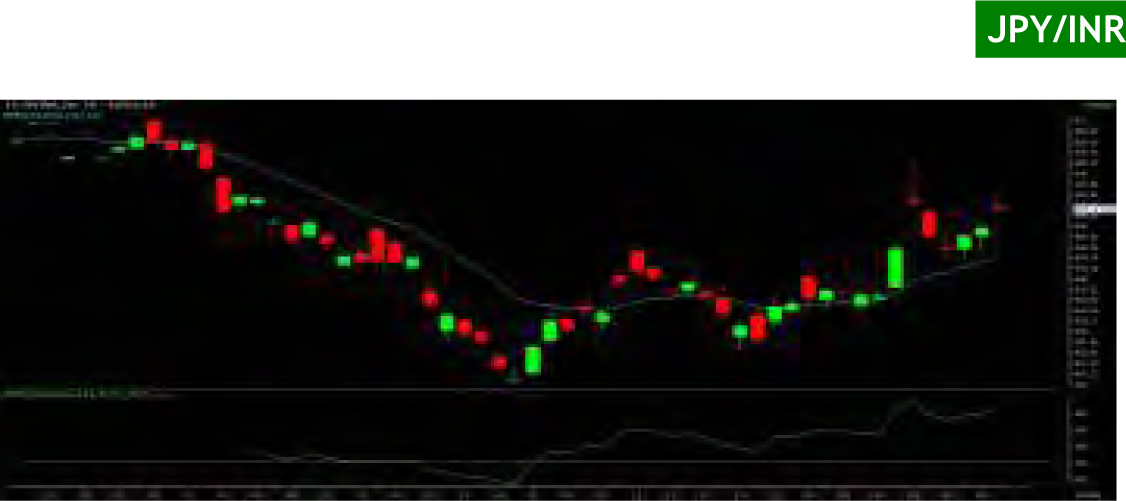
JPY/INR (JAN) contract closed at 65.31 on 10th Jan’ 19. The contract made its high of 65.63 on 10th Jan’19 and a low of 64.2825 on 7th Jan’19 (Weekly Basis). The 14-day Exponential Moving Average of the JPY/INR is currently at 64.44

On the daily chart, JPY/INR has Relative Strength Index (14-day) value of 63.35. One can buy at 64.80 for a target of 65.40 with the stop loss of 64.50.


14

IPO


IPO TRACKER


Cabinet approves listing of seven government-owned companies

The Cabinet Committee on Economic Affairs (CCEA) approved the plan to list seven public sector companies on the stock exchanges through Initial Public Offering (IPO) or Further Public Offer (FPO). These seven companies are Telecommunication Consultants (India) Pvt Ltd, Railtel Corporation India, National Seed Corporation India, Tehri Hydro Development Corporation, Water & Power Consultancy Services (India), FCI Aravali Gypsum and Minerals (India) and Kudremukh Iron Ore Company. The Cabinet also gave its nod for a hike in minimum support price (MSP) for Copra by more than Rs 2000 per quintal for the 2019 season. The MSP of Milling Copra will be Rs 9521 per quintal and that of Ball Copra will be Rs 9920 per quintal. IT Minister Ravi Shankar Prasad also said while briefing the media that the Cabinet approved Coastal Regulation Zone (CRZ) Notification 2018. This notification will lead to enhanced activities in the coastal regions and will promote economic growth while also respecting the conservation principles of coastal regions, the government said. The Centre also greenlighted the National Commission for Homeopathy (NCH) Bill, 2018 which seeks to replace the existing regulator Central Council for Homeopathy with a new body to ensure transparency.

Prince Pipes' revised IPO plan gets regulatory nod

Prince Pipes and Fittings Ltd, a maker of PVC pipes for plumbing, irrigation and sewage works, has received regulatory approval for its revised initial public offering (IPO) proposal. The Securities and Exchange Board of India (SEBI) issued final observations to Prince Pipes’ revised proposal on 28 December 2018, the capital markets regulator's website shows.

SME IPOs make a mark in 2018; record Rs 2,455 cr garnered

Spurred by investor interest, 145 small and medium enterprises (SMEs) raised a record Rs 2,455 crore through initial public offerings (IPOs) in 2018, a surge of 37 per cent from the funds raised in the preceding year. A total of 145 SMEs got listed with IPOs worth Rs 2,455 crore last year as compared with 133 firms garnering Rs 1,785 crore in 2017 through the route, according to data compiled by Pantomath Research. Overall, a total of 474 firms have garnered Rs 5,825 crore since 2012, when leading stock exchanges -- the BSE and the National Stock Exchange (NSE) - launched the SME platforms.


15

FIXED DEPOSIT MONITOR


FIXED DEPOSIT COMPANIES


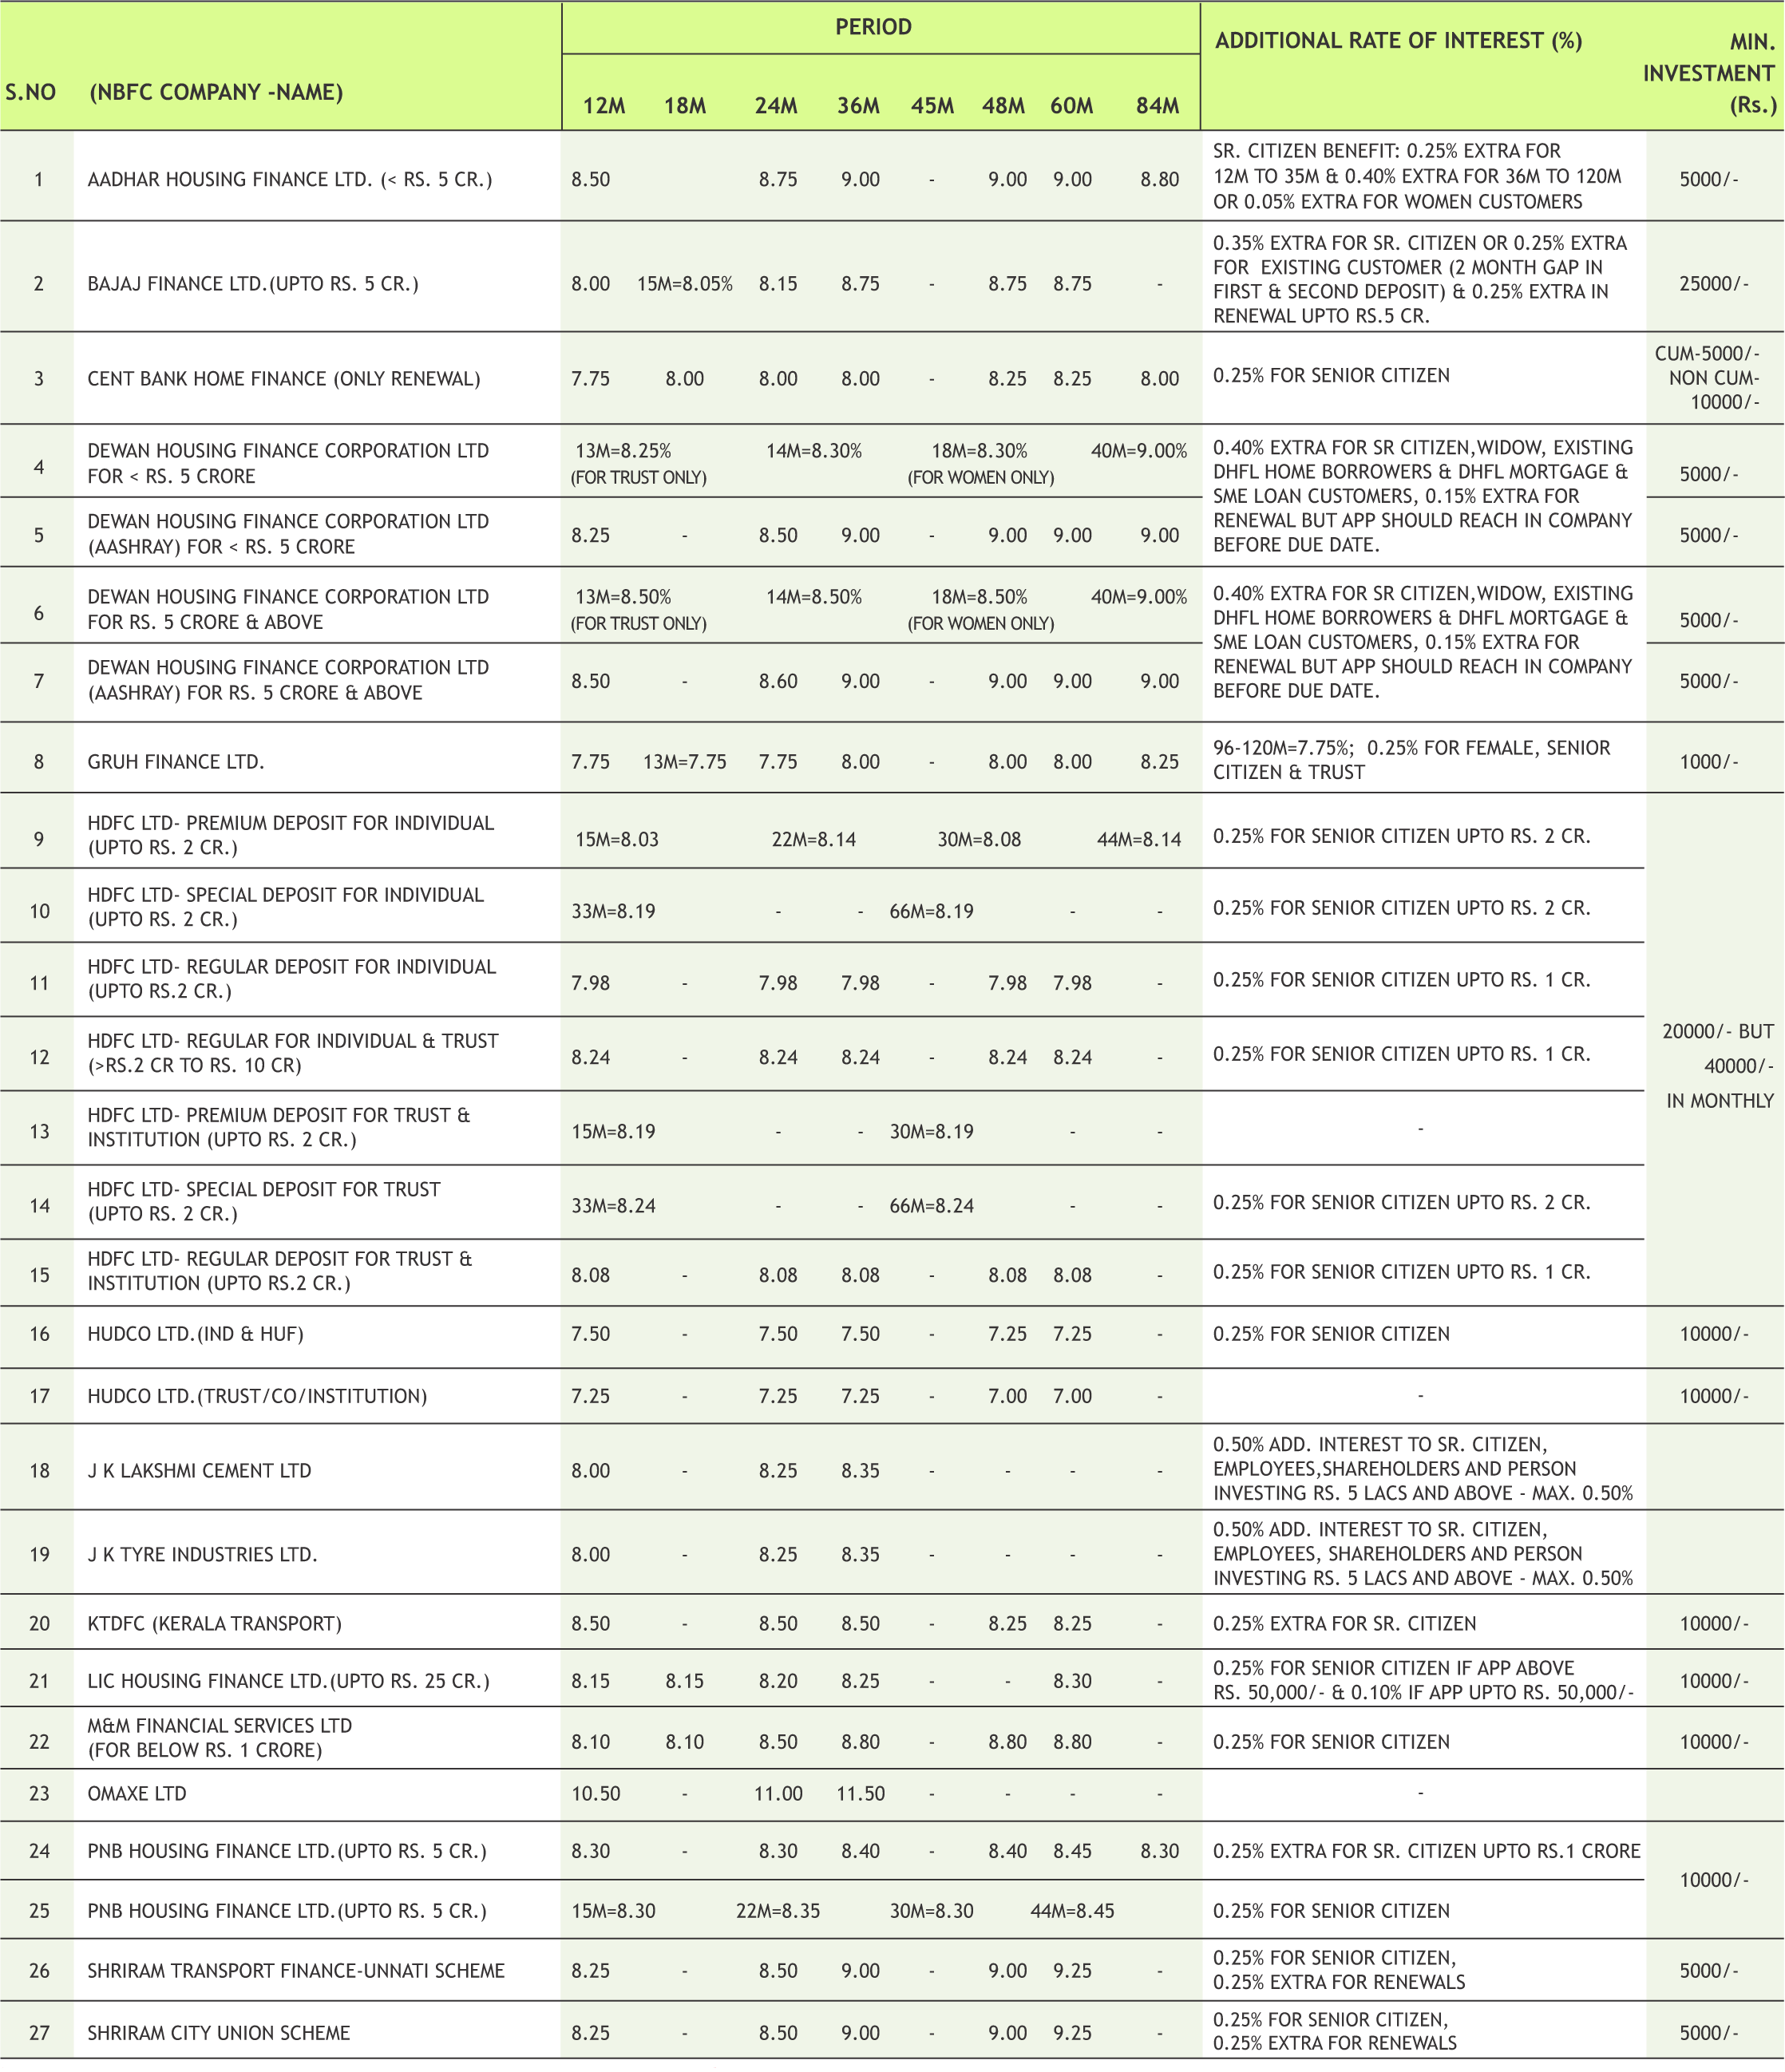
* Interest Rate may be revised by company from time to time. Please confirm Interest rates before submitting the application.

* For Application of Rs.50 Lac & above, Contact to Head Office.

* Email us at fd@smcindiaonline.com


16

MUTUAL FUND


INDUSTRY & FUND UPDATE

Largest mutual fund in India: HDFC MF surpasses ICICI Prudential MF to become largest AMC

HDFC Mutual Fund has pipped ICICI Prudential MF to become the country's largest asset management company after a gap of over two years. As of December-end, HDFC MF manages assets to the tune of Rs 3.35 lakh crore, while those of ICICI Prudential MF stood at Rs 3.08 lakh crore, as per the latest data available with Association of Mutual funds in India (Amfi). The assets under management (AUM) of HDFC MF have grown over 9 per cent in October-December quarter from the previous three-month period, however, ICICI Prudential MF's AUM slipped by 0.6 per cent during the period under review. HDFC MF was the largest asset manager since October 2011 and it held the numero uno position till March 2016, when ICICI prudential MF had overtaken the top spot. On month-on-month basis, ICICI Prudential MF had surpassed HDFC MF in terms of AUM in February 2016 and had reached the top position. SBI MF is at the third slot with AUM of Rs 2.64 lakh crore, followed by Aditya Birla Sun Life MF (Rs 2.42 lakh crore) and Reliance MF (Rs 2.36 lakh crore). Overall, asset base of the country's mutual fund industry was at Rs 23.61 lakh crore at the end of December quarter.

Mutual Fund flow weakens in Dec 2018

According to media reports, mutual fund inflow slumped and hit a 30-month low in Dec 2018 amid market volatility, global uncertainty and the approaching elections. Liquid funds saw a net outflow of Rs. 1.49 lakh crore, while equity funds witnessed an inflow of Rs. 6,651 crore (the lowest in 2018) during the month. The total asset under management (AUM) declined to Rs. 22.86 lakh crore in Dec 2018 compared with Rs. 24.03 lakh crore in Nov 2018.

AMFI reports 4.9% decline in asset base in Dec 2018

Association of Mutual Fund in India (AMFI) reported data for Dec 2018 with the asset under management (AUM) of the mutual fund industry declining 4.9% from Rs. 24.03 lakh crore in Nov 2018 to Rs. 22.86 lakh crore. The industry suffered the drop due to net outflow of Rs. 1.37 lakh crore, which was majorly due to high outflow from liquid schemes. However, equity and equity linked savings funds witnessed inflow of Rs. 6,606 crore during the month.

Kotak Mahindra Mutual Fund announced the launch of Kotak Overnight Fund

Kotak Mahindra Mutual Fund announced the launch of Kotak Overnight Fund, an open-ended debt scheme investing in overnight securities. The NFO will open for subscription on Jan 10, 2019 and close on Jan 14, 2019.

Aditya Birla Sun Life Mutual Fund changes name of Aditya Birla Sun Life Floating Rate Fund - Long Term Plan

Aditya Birla Sun Life Mutual Fund announced the change in name of Aditya Birla Sun Life Floating Rate Fund - Long Term Plan. The scheme’s revised name stands as Aditya Birla Sun Life Floating Rate Fund with effect from Dec 26, 2018.

NEW FUND OFFER

  • Scheme Name
  • Fund Type
  • Fund Class
  • Opens on
  • Closes on
  • Investment Objective
  • Min. Investment
  • Fund Manager
  • Yes Liquid Fund - Regular Plan (G)
  • Open Ended
  • Growth
  • 02-Jan-2019
  • 16-Jan-2019
  • To generate optimal returns consistent with moderate levels of risk and high liquidity by investing in high quality debt and money market instruments.

  • Rs.10000/-
  • Piyush Baranwal
  • Scheme Name
  • Fund Type
  • Fund Class
  • Opens on
  • Closes on
  • Investment Objective
  • Min. Investment
  • Fund Manager
  • UTI Fixed Term Income Fund - Series XXXI - II (1222 Days) (G)
  • Close-Ended
  • Growth
  • 03-Jan-2019
  • 17-Jan-2019
  • To generate returns by investing in a portfolio of fixed income securities maturing on or before the date of maturity of the scheme.

  • Rs.5000/-
  • Sunil Patil
  • Scheme Name
  • Fund Type
  • Fund Class
  • Opens on
  • Closes on
  • Investment Objective
  • Min. Investment
  • Fund Manager
  • LIC MF Arbitrage Fund
  • Open Ended
  • Hybrid Scheme - Arbitrage Fund
  • 04-Jan-2019
  • 18-Jan-2019
  • To generate income by taking advantage of arbitrage opportunities that potentially exists between cash and derivative market and within the derivative segment along with investments in debt securities & money market instruments. However, there can be no assurance that the investment objective of the scheme will be realized.
  • Rs5000 & in multiples of Rs1 thereafter
  • Yogesh Patil / Marzban Irani
  • Scheme Name
  • Fund Type
  • Fund Class
  • Opens on
  • Closes on
  • Investment Objective
  • Min. Investment
  • Fund Manager
  • Edelweiss Small Cap Fund
  • Open Ended
  • Equity Scheme - Small Cap Fund
  • 18-Jan-2019
  • 01-Feb-2019
  • To generate long term capital appreciation from a portfolio that predominantly invests in equity and equity related securities of small cap companies. However, there is no assurance that the investment objective of the Scheme will be realized and the Scheme does not assure or guarantee any returns.
  • Rs.5000/-
  • Harshad Patwardhan

17


MUTUAL FUND

Performance Charts


EQUITY (Diversified)
TAX Fund
BALANCED
INCOME FUND
SHORT
Due to their inherent short term nature, Short term funds have been sorted on the basis of 6month returns

Note:Indicative corpus are including Growth & Dividend option . The above mentioned data is on the basis of 08/08/2019 Beta, Sharpe and Standard Deviation are calculated on the basis of period: 1 year, frequency: Weekly Friday, RF: 7%


*Mutual Fund investments are subject to market risks, read all scheme related documents carefully

17

Mr. Ajay Garg (Director & CEO, SMC Global Securities Ltd), Ms. Nidhi Bansal (Regional Director, SMC Global Securities Ltd), Mr. Uday Prabhakar Powale (Zonal Head, SMC Global Securities Ltd) and Ms. Kuntal V Bhat (Deputy Vice President, SMC Global Securities Ltd) during the ANMI 10th International Convention - "Capital Markets in the Age of Disruption" held on Saturday, 12th January, 2019 at Hotel Grand Hyatt, Mumbai.

SMC participated in the Annual Sports Fest of IIM Indore - Ranbhoomi 2019 held from 18th to 20th January, 2019 at IIM Campus, Indore.

SMC on the occasion of Netaji Subhash Chandra Bose Jayanti 2019 organised Sit and Draw competition along with Aditya Birla Capital to promote Mutual Fund on Wednesday, 23rd January, 2019 at Netaji Club, Malda, West Bengal.

SMC GLOBAL SECURITIES LTD.

REGISTERED OFFICES:

11 / 6B, Shanti Chamber, Pusa Road, New Delhi 110005. Tel: 91-11-30111000, Fax: 91-11-25754365

MUMBAI OFFICE:

Lotus Corporate Park, A Wing 401 / 402 , 4th Floor , Graham Firth Steel Compound, Off Western Express Highway, Jay Coach Signal, Goreagon (East) Mumbai - 400063

Tel: 91-22-67341600, Fax: 91-22-67341697

KOLKATA OFFICE:

18, Rabindra Sarani, Poddar Court, Gate No-4,5th Floor, Kolkata-700001 Tel.: 033 6612 7000/033 4058 7000, Fax: 033 6612 7004/033 4058 7004

AHMEDABAD OFFICE :

10/A, 4th Floor, Kalapurnam Building, Near Municipal Market, C G Road, Ahmedabad-380009, Gujarat

Tel : 91-79-26424801 - 05, 40049801 - 03

CHENNAI OFFICE:

Salzburg Square, Flat No.1, III rd Floor, Door No.107, Harrington Road, Chetpet, Chennai - 600031.

Tel: 044-39109100, Fax -044- 39109111

SECUNDERABAD OFFICE:

315, 4th Floor Above CMR Exclusive, BhuvanaTower, S D Road, Secunderabad, Telangana-500003

Tel : 040-30031007/8/9

DUBAI OFFICE:

2404, 1 Lake Plaza Tower, Cluster T, Jumeriah Lake Towers, PO Box 117210, Dubai, UAE

Tel: 97145139780 Fax : 97145139781

Email ID : pankaj@smccomex.com

smcdmcc@gmail.com

Printed and Published on behalf of

Mr. Saurabh Jain @ Publication Address

11/6B, Shanti Chamber, Pusa Road, New Delhi-110005

Website: www.smcindiaonline.com

Investor Grievance : igc@smcindiaonline.com

Printed at: S&S MARKETING

102, Mahavirji Complex LSC-3, Rishabh Vihar, New Delhi - 110092 (India) Ph.: +91-11- 43035012, 43035014, Email: ss@sandsmarketing.in